Shareholders Should Be Pleased With Harrow, Inc.'s (NASDAQ:HROW) Price
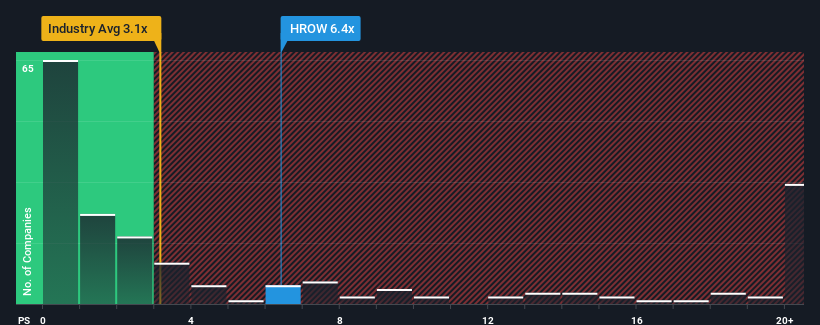
Harrow, Inc.'s (NASDAQ:HROW) price-to-sales (or "P/S") ratio of 6.4x might make it look like a strong sell right now compared to the Pharmaceuticals industry in the United States, where around half of the companies have P/S ratios below 3.1x and even P/S below 1x are quite common. However, the P/S might be quite high for a reason and it requires further investigation to determine if it's justified.
See our latest analysis for Harrow
How Has Harrow Performed Recently?
Harrow certainly has been doing a good job lately as it's been growing revenue more than most other companies. It seems that many are expecting the strong revenue performance to persist, which has raised the P/S. However, if this isn't the case, investors might get caught out paying too much for the stock.
Want the full picture on analyst estimates for the company? Then our free report on Harrow will help you uncover what's on the horizon.Do Revenue Forecasts Match The High P/S Ratio?
Harrow's P/S ratio would be typical for a company that's expected to deliver very strong growth, and importantly, perform much better than the industry.
Taking a look back first, we see that the company grew revenue by an impressive 48% last year. The latest three year period has also seen an excellent 153% overall rise in revenue, aided by its short-term performance. Therefore, it's fair to say the revenue growth recently has been superb for the company.
Looking ahead now, revenue is anticipated to climb by 55% per year during the coming three years according to the five analysts following the company. That's shaping up to be materially higher than the 24% per annum growth forecast for the broader industry.
With this in mind, it's not hard to understand why Harrow's P/S is high relative to its industry peers. It seems most investors are expecting this strong future growth and are willing to pay more for the stock.
What We Can Learn From Harrow's P/S?
We'd say the price-to-sales ratio's power isn't primarily as a valuation instrument but rather to gauge current investor sentiment and future expectations.
We've established that Harrow maintains its high P/S on the strength of its forecasted revenue growth being higher than the the rest of the Pharmaceuticals industry, as expected. Right now shareholders are comfortable with the P/S as they are quite confident future revenues aren't under threat. It's hard to see the share price falling strongly in the near future under these circumstances.
Many other vital risk factors can be found on the company's balance sheet. Our free balance sheet analysis for Harrow with six simple checks will allow you to discover any risks that could be an issue.
Of course, profitable companies with a history of great earnings growth are generally safer bets. So you may wish to see this free collection of other companies that have reasonable P/E ratios and have grown earnings strongly.
Valuation is complex, but we're here to simplify it.
Discover if Harrow might be undervalued or overvalued with our detailed analysis, featuring fair value estimates, potential risks, dividends, insider trades, and its financial condition.
Access Free AnalysisHave feedback on this article? Concerned about the content? Get in touch with us directly. Alternatively, email editorial-team (at) simplywallst.com.This article by Simply Wall St is general in nature. We provide commentary based on historical data and analyst forecasts only using an unbiased methodology and our articles are not intended to be financial advice. It does not constitute a recommendation to buy or sell any stock, and does not take account of your objectives, or your financial situation. We aim to bring you long-term focused analysis driven by fundamental data. Note that our analysis may not factor in the latest price-sensitive company announcements or qualitative material. Simply Wall St has no position in any stocks mentioned.
免責聲明:投資有風險,本文並非投資建議,以上內容不應被視為任何金融產品的購買或出售要約、建議或邀請,作者或其他用戶的任何相關討論、評論或帖子也不應被視為此類內容。本文僅供一般參考,不考慮您的個人投資目標、財務狀況或需求。TTM對信息的準確性和完整性不承擔任何責任或保證,投資者應自行研究並在投資前尋求專業建議。
熱議股票
- 1
- 2
- 3
- 4
- 5
- 6
- 7
- 8
- 9
- 10