Is Zhuzhou CRRC Times Electric Co., Ltd. (HKG:3898) Trading At A 42% Discount?
Key Insights
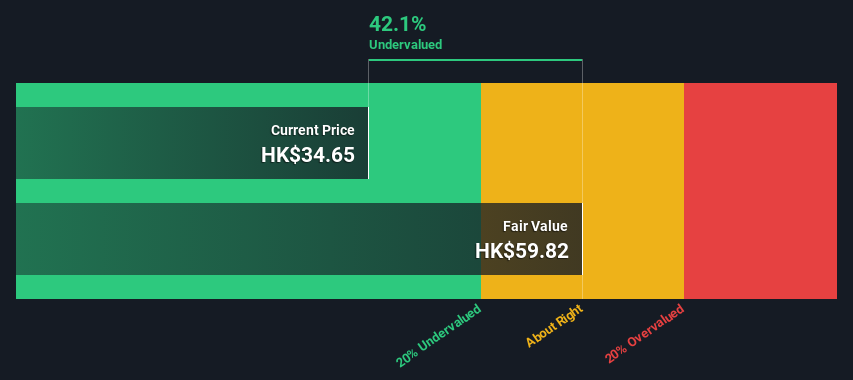
- The projected fair value for Zhuzhou CRRC Times Electric is HK$59.82 based on 2 Stage Free Cash Flow to Equity
- Zhuzhou CRRC Times Electric is estimated to be 42% undervalued based on current share price of HK$34.65
- Analyst price target for 3898 is CN¥36.69 which is 39% below our fair value estimate
In this article we are going to estimate the intrinsic value of Zhuzhou CRRC Times Electric Co., Ltd. (HKG:3898) by estimating the company's future cash flows and discounting them to their present value. One way to achieve this is by employing the Discounted Cash Flow (DCF) model. Models like these may appear beyond the comprehension of a lay person, but they're fairly easy to follow.
We would caution that there are many ways of valuing a company and, like the DCF, each technique has advantages and disadvantages in certain scenarios. If you want to learn more about discounted cash flow, the rationale behind this calculation can be read in detail in the Simply Wall St analysis model.
View our latest analysis for Zhuzhou CRRC Times Electric
Crunching The Numbers
We are going to use a two-stage DCF model, which, as the name states, takes into account two stages of growth. The first stage is generally a higher growth period which levels off heading towards the terminal value, captured in the second 'steady growth' period. To begin with, we have to get estimates of the next ten years of cash flows. Where possible we use analyst estimates, but when these aren't available we extrapolate the previous free cash flow (FCF) from the last estimate or reported value. We assume companies with shrinking free cash flow will slow their rate of shrinkage, and that companies with growing free cash flow will see their growth rate slow, over this period. We do this to reflect that growth tends to slow more in the early years than it does in later years.
Generally we assume that a dollar today is more valuable than a dollar in the future, and so the sum of these future cash flows is then discounted to today's value:
10-year free cash flow (FCF) forecast
| 2025 | 2026 | 2027 | 2028 | 2029 | 2030 | 2031 | 2032 | 2033 | 2034 | |
| Levered FCF (CN¥, Millions) | CN¥1.51b | CN¥2.30b | CN¥2.92b | CN¥3.50b | CN¥4.01b | CN¥4.45b | CN¥4.82b | CN¥5.14b | CN¥5.42b | CN¥5.66b |
| Growth Rate Estimate Source | Analyst x5 | Analyst x5 | Est @ 27.23% | Est @ 19.79% | Est @ 14.59% | Est @ 10.94% | Est @ 8.39% | Est @ 6.61% | Est @ 5.36% | Est @ 4.48% |
| Present Value (CN¥, Millions) Discounted @ 7.8% | CN¥1.4k | CN¥2.0k | CN¥2.3k | CN¥2.6k | CN¥2.8k | CN¥2.8k | CN¥2.9k | CN¥2.8k | CN¥2.8k | CN¥2.7k |
("Est" = FCF growth rate estimated by Simply Wall St)Present Value of 10-year Cash Flow (PVCF) = CN¥25b
The second stage is also known as Terminal Value, this is the business's cash flow after the first stage. The Gordon Growth formula is used to calculate Terminal Value at a future annual growth rate equal to the 5-year average of the 10-year government bond yield of 2.4%. We discount the terminal cash flows to today's value at a cost of equity of 7.8%.
Terminal Value (TV)= FCF2034 × (1 + g) ÷ (r – g) = CN¥5.7b× (1 + 2.4%) ÷ (7.8%– 2.4%) = CN¥109b
Present Value of Terminal Value (PVTV)= TV / (1 + r)10= CN¥109b÷ ( 1 + 7.8%)10= CN¥52b
The total value is the sum of cash flows for the next ten years plus the discounted terminal value, which results in the Total Equity Value, which in this case is CN¥77b. To get the intrinsic value per share, we divide this by the total number of shares outstanding. Relative to the current share price of HK$34.7, the company appears quite undervalued at a 42% discount to where the stock price trades currently. Remember though, that this is just an approximate valuation, and like any complex formula - garbage in, garbage out.
The Assumptions
The calculation above is very dependent on two assumptions. The first is the discount rate and the other is the cash flows. Part of investing is coming up with your own evaluation of a company's future performance, so try the calculation yourself and check your own assumptions. The DCF also does not consider the possible cyclicality of an industry, or a company's future capital requirements, so it does not give a full picture of a company's potential performance. Given that we are looking at Zhuzhou CRRC Times Electric as potential shareholders, the cost of equity is used as the discount rate, rather than the cost of capital (or weighted average cost of capital, WACC) which accounts for debt. In this calculation we've used 7.8%, which is based on a levered beta of 1.010. Beta is a measure of a stock's volatility, compared to the market as a whole. We get our beta from the industry average beta of globally comparable companies, with an imposed limit between 0.8 and 2.0, which is a reasonable range for a stable business.
SWOT Analysis for Zhuzhou CRRC Times Electric
- Earnings growth over the past year exceeded the industry.
- Debt is not viewed as a risk.
- Balance sheet summary for 3898.
- Dividend is low compared to the top 25% of dividend payers in the Machinery market.
- Annual earnings are forecast to grow faster than the Hong Kong market.
- Trading below our estimate of fair value by more than 20%.
- Paying a dividend but company has no free cash flows.
- Revenue is forecast to grow slower than 20% per year.
- See 3898's dividend history.
Moving On:
Whilst important, the DCF calculation shouldn't be the only metric you look at when researching a company. It's not possible to obtain a foolproof valuation with a DCF model. Instead the best use for a DCF model is to test certain assumptions and theories to see if they would lead to the company being undervalued or overvalued. For instance, if the terminal value growth rate is adjusted slightly, it can dramatically alter the overall result. What is the reason for the share price sitting below the intrinsic value? For Zhuzhou CRRC Times Electric, we've compiled three essential elements you should explore:
- Financial Health: Does 3898 have a healthy balance sheet? Take a look at our free balance sheet analysis with six simple checks on key factors like leverage and risk.
- Future Earnings: How does 3898's growth rate compare to its peers and the wider market? Dig deeper into the analyst consensus number for the upcoming years by interacting with our free analyst growth expectation chart.
- Other Solid Businesses: Low debt, high returns on equity and good past performance are fundamental to a strong business. Why not explore our interactive list of stocks with solid business fundamentals to see if there are other companies you may not have considered!
PS. Simply Wall St updates its DCF calculation for every Hong Kong stock every day, so if you want to find the intrinsic value of any other stock just search here.
Valuation is complex, but we're here to simplify it.
Discover if Zhuzhou CRRC Times Electric might be undervalued or overvalued with our detailed analysis, featuring fair value estimates, potential risks, dividends, insider trades, and its financial condition.
Access Free AnalysisHave feedback on this article? Concerned about the content? Get in touch with us directly. Alternatively, email editorial-team (at) simplywallst.com.This article by Simply Wall St is general in nature. We provide commentary based on historical data and analyst forecasts only using an unbiased methodology and our articles are not intended to be financial advice. It does not constitute a recommendation to buy or sell any stock, and does not take account of your objectives, or your financial situation. We aim to bring you long-term focused analysis driven by fundamental data. Note that our analysis may not factor in the latest price-sensitive company announcements or qualitative material. Simply Wall St has no position in any stocks mentioned.
免責聲明:投資有風險,本文並非投資建議,以上內容不應被視為任何金融產品的購買或出售要約、建議或邀請,作者或其他用戶的任何相關討論、評論或帖子也不應被視為此類內容。本文僅供一般參考,不考慮您的個人投資目標、財務狀況或需求。TTM對信息的準確性和完整性不承擔任何責任或保證,投資者應自行研究並在投資前尋求專業建議。
熱議股票
- 1
- 2
- 3
- 4
- 5
- 6
- 7
- 8
- 9
- 10