Carter Q4 Earnings & Sales Surpass Estimates, Stock Down
Carter's, Inc. CRI announced its fourth-quarter 2024 results, wherein the top and the bottom lines beat the Zacks Consensus Estimate. Additionally, on a year-over-year basis, the company’s top line increased marginally, but the bottom line declined.
Carter’s shares plummeted more than 16% yesterday as its better-than-expected earnings report failed to boost investor confidence. While the company’s overall revenues remained steady, declining momentum in the U.S. Retail and International segments overshadowed growth in the U.S. Wholesale division.
Rising freight costs and intensified promotional competition squeezed profit margins, while macroeconomic challenges, including high interest rates and inflation, dampened consumer confidence. Despite these setbacks, same-store sales surpassed analyst expectations.
Carter’s adjusted earnings per share (EPS) of $2.39 surpassed the Zacks Consensus Estimate of $1.72. However, the bottom line fell 13.4% from $2.76 reported in the prior-year quarter.
Carter's, Inc. Price, Consensus and EPS Surprise
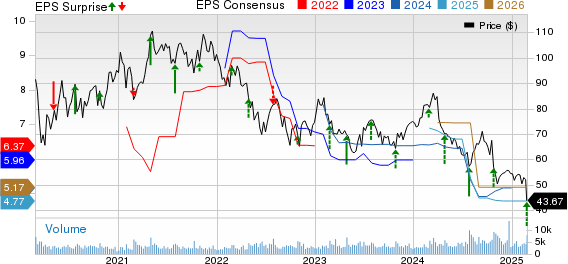
Carter's, Inc. price-consensus-eps-surprise-chart | Carter's, Inc. Quote
Find the latest EPS estimates and surprises on Zacks Earnings Calendar.
The company reported consolidated net sales of $859.7 million, which beat the Zacks Consensus Estimate of $828 million. The metric rose 0.2% from $857.9 million posted in the year-ago period. The company’s sales remained almost flat as gains in U.S. Wholesale were offset by declines in U.S. Retail and International segments. Persistent macroeconomic challenges, including inflation and high interest rates, continued to impact families with young children, weighing on brand demand in the fourth quarter of fiscal 2024. Adverse currency rates impacted net sales by $5.9 million.
Shares of this Zacks Rank #3 (Hold) company have lost 19.1% in the past three months against the industry’s 2.7% growth.
CRI Stock's Past Three Month Performance
Image Source: Zacks Investment Research

Insights Into CRI’s Segment
Sales of the U.S. Retail segment decreased 2.8% year over year to $466.2 million. The segment’s comparable net sales fell 3.4% in the fourth quarter. Our model predicted sales of $435.3 million for the segment.
The U.S. Wholesale segment’s sales rose 7.3% year over year to $265.4 million, driven in part by favorable changes in the timing of shipments. We expected net sales of $269.7 million for the segment.
The International segment witnessed a 2% year-over-year drop in sales to $128.1 million. We expected net sales of $123.5 million for the segment.
Focus on CRI’s Margins
Gross profit fell 1.7% year over year to $411 million. The gross margin contracted 90 basis points (bps) to 47.8% compared with 48.7% in the fourth quarter of 2024. The decline was largely due to a $30 million investment in more competitive pricing within the U.S. Retail segment. However, the impact of lower prices was mostly offset by reduced product costs. Additional pressure on gross margin came from higher freight rates and a greater mix of wholesale sales.
Adjusted operating income decreased 15.4% year over year to $21 million. The adjusted operating margin decreased 250 bps to 13.4%, impacted by investments in pricing, marketing, and stores; higher inbound freight rates; and increased charitable contributions. These were somewhat offset by lower product costs and performance-based compensation expenses.
Selling, general and administrative (SG&A) expenses increased 5.3% year over year to $302.1 million in the quarter. As a percentage of net sales, SG&A expenses increased 160 bps year over year to 35.1%.
CRI’s Financial Snapshot
Carter’s ended 2024 with cash and cash equivalents of $413 million, long-term debt of $498.1 million and shareholders’ equity of $854.6 million.
In the fourth quarter of 2024, the company returned $28.8 million to its shareholders through cash dividends. In 2024, CRI returned a total of $166.7 million to its shareholders through cash dividends and share repurchases.
CRI repurchased and retired nearly 0.7 million shares of its common stock for $50.5 million at an average price of $68.61 per share in 2024. As of Dec. 28, 2024, CRI had $599 million remaining under its previously announced repurchase authorization.
Also, Carter paid out a dividend of 80 cents per share for a total of $28.8 million in the quarter.
Sneak Peek Into Carter’s Outlook
For the first quarter of 2025, Carter’s expects net sales of $615-$625 million, indicating a decline from the $661 million recorded in the year-ago quarter. Adjusted earnings are expected to be 45-55 cents per share, down from $1.04 reported in the prior-year quarter. Adjusted operating income is expected to be $30-$35 million, implying a decrease from $55 million in the year-ago quarter.
In the U.S. Retail business, total sales are expected to fall in the mid-single-digit to high-single-digit for the first quarter. In U.S. Wholesale, the company anticipates sales to decrease high-single digits year over year, whereas international sales are expected to dip mid-single-digit year over year.
For the U.S. Retail business, the company expects comparable sales to be down mid- to high-single digits.
For 2025, Carter’s expects net sales of $2.78-$2.86 billion compared with $2.84 billion in 2024. The company anticipates an adjusted operating income of $180-$210 million, lower than $287 million in 2024. It expects adjusted earnings per share of $3.20-$3.80 compared with $5.81 in 2024. Fiscal 2025 is expected to have a 53rd week, contributing an estimated $30 million in net sales.
Carter’s anticipates an increase in SG&A for fiscal 2025 rising in the low single digits year over year, due to an increase in the restoration of variable compensation programs, which will add $30 million to $35 million to SG&A.
For 2025, Carter’s expects a mid-single-digit decline in U.S. Retail sales, with comparable store sales projected to decline in the low to mid-single digits. However, CRI expects trends to improve in the second half of 2025 due to better inventory management and enhanced product and promotional strategies.
Sales for the U.S. Wholesale segment are anticipated to be between low single-digit growth and a low single-digit decline. Growth in exclusive brands is expected to continue in 2025. Meanwhile, sales for the International segment are expected to be flat to up low single digits However, a stronger U.S. dollar compared to the Mexican peso and Canadian dollar will negatively impact the profitability of international operations.
CRI expects an operating cash flow of $200 million, while capital expenditure is anticipated to be $65 million.
For 2025, it is envisioned that several factors will weigh on profitability, including residual lower pricing in the first half of the year, higher product costs and the restoration of more normalized variable compensation provisions. The company plans to rely less on pricing actions and instead focus on improving merchandise assortments and strengthening overall inventory positions, particularly in the more significant second half of the year.
Key Picks
We have highlighted three top-ranked stocks, namely, Under Armour UAA, Ralph Lauren Corporation RL and lululemon athletica LULU.
Under Armour is one of the leading designers, marketers, and distributors of authentic athletic footwear, apparel and accessories for a wide variety of sports and fitness activities in the United States and internationally. It has a Zacks Rank of 2 (Buy) at present. You can see the complete list of today’s Zacks #1 Rank (Strong Buy) stocks here.
The Zacks Consensus Estimate for UAA’s fiscal 2024 sales and earnings indicates declines of 9.9% and 44.4%, respectively, from the year-ago reported figures. Under Armour delivered an earnings surprise of 98.6% in the trailing four quarters, on average.
Ralph Lauren designs, markets and distributes lifestyle products in North America, Europe, Asia and internationally. It currently carries a Zacks Rank #2.
RL has a trailing four-quarter earnings surprise of 6.5%, on average. The consensus estimate for Ralph Lauren’s current financial year sales and earnings indicates advancements of 5.8% and 16.5%, respectively, from the prior-year figures.
lululemon is a yoga-inspired athletic apparel company. LULU carries a Zacks Rank of 2 at present.
Want the latest recommendations from Zacks Investment Research? Today, you can download 7 Best Stocks for the Next 30 Days. Click to get this free report
Ralph Lauren Corporation (RL) : Free Stock Analysis Report
lululemon athletica inc. (LULU) : Free Stock Analysis Report
Carter's, Inc. (CRI) : Free Stock Analysis Report
Under Armour, Inc. (UAA) : Free Stock Analysis Report
This article originally published on Zacks Investment Research (zacks.com).
Zacks Investment Research
免責聲明:投資有風險,本文並非投資建議,以上內容不應被視為任何金融產品的購買或出售要約、建議或邀請,作者或其他用戶的任何相關討論、評論或帖子也不應被視為此類內容。本文僅供一般參考,不考慮您的個人投資目標、財務狀況或需求。TTM對信息的準確性和完整性不承擔任何責任或保證,投資者應自行研究並在投資前尋求專業建議。
熱議股票
- 1
- 2
- 3
- 4
- 5
- 6
- 7
- 8
- 9
- 10