Daqo New Energy (NYSE:DQ) pulls back 12% this week, but still delivers shareholders decent 12% CAGR over 5 years
Daqo New Energy Corp. (NYSE:DQ) shareholders might be concerned after seeing the share price drop 12% in the last week. On the bright side the share price is up over the last half decade. However we are not very impressed because the share price is only up 79%, less than the market return of 148%. Unfortunately not all shareholders will have held it for the long term, so spare a thought for those caught in the 27% decline over the last twelve months.
Although Daqo New Energy has shed US$170m from its market cap this week, let's take a look at its longer term fundamental trends and see if they've driven returns.
Check out our latest analysis for Daqo New Energy
In his essay The Superinvestors of Graham-and-Doddsville Warren Buffett described how share prices do not always rationally reflect the value of a business. One imperfect but simple way to consider how the market perception of a company has shifted is to compare the change in the earnings per share (EPS) with the share price movement.
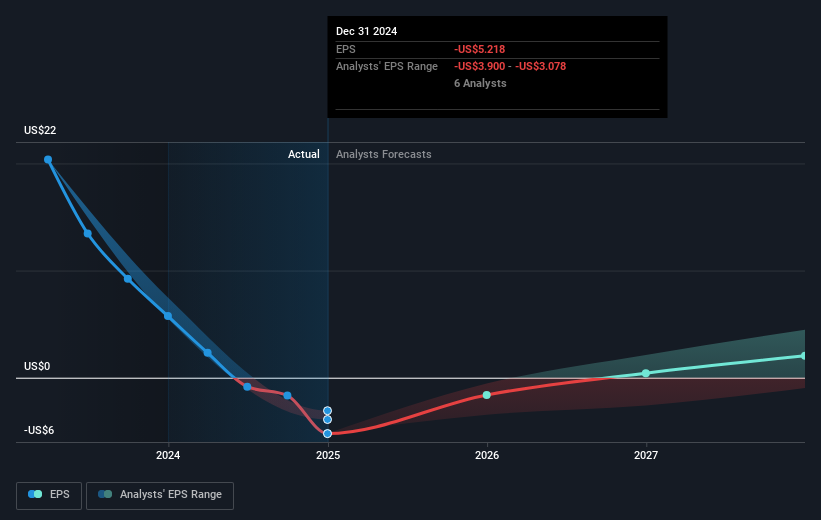
During five years of share price growth, Daqo New Energy achieved compound earnings per share (EPS) growth of 4.4% per year. This EPS growth is lower than the 12% average annual increase in the share price. This suggests that market participants hold the company in higher regard, these days. That's not necessarily surprising considering the five-year track record of earnings growth.
You can see how EPS has changed over time in the image below (click on the chart to see the exact values).
Dive deeper into Daqo New Energy's key metrics by checking this interactive graph of Daqo New Energy's earnings, revenue and cash flow.
A Different Perspective
Daqo New Energy shareholders are down 27% for the year, but the market itself is up 13%. However, keep in mind that even the best stocks will sometimes underperform the market over a twelve month period. On the bright side, long term shareholders have made money, with a gain of 12% per year over half a decade. If the fundamental data continues to indicate long term sustainable growth, the current sell-off could be an opportunity worth considering. Shareholders might want to examine this detailed historical graph of past earnings, revenue and cash flow.
If you like to buy stocks alongside management, then you might just love this free list of companies. (Hint: many of them are unnoticed AND have attractive valuation).
Please note, the market returns quoted in this article reflect the market weighted average returns of stocks that currently trade on American exchanges.
New: Manage All Your Stock Portfolios in One Place
We've created the ultimate portfolio companion for stock investors, and it's free.
• Connect an unlimited number of Portfolios and see your total in one currency• Be alerted to new Warning Signs or Risks via email or mobile• Track the Fair Value of your stocks
Try a Demo Portfolio for FreeHave feedback on this article? Concerned about the content? Get in touch with us directly. Alternatively, email editorial-team (at) simplywallst.com.This article by Simply Wall St is general in nature. We provide commentary based on historical data and analyst forecasts only using an unbiased methodology and our articles are not intended to be financial advice. It does not constitute a recommendation to buy or sell any stock, and does not take account of your objectives, or your financial situation. We aim to bring you long-term focused analysis driven by fundamental data. Note that our analysis may not factor in the latest price-sensitive company announcements or qualitative material. Simply Wall St has no position in any stocks mentioned.
免責聲明:投資有風險,本文並非投資建議,以上內容不應被視為任何金融產品的購買或出售要約、建議或邀請,作者或其他用戶的任何相關討論、評論或帖子也不應被視為此類內容。本文僅供一般參考,不考慮您的個人投資目標、財務狀況或需求。TTM對信息的準確性和完整性不承擔任何責任或保證,投資者應自行研究並在投資前尋求專業建議。
熱議股票
- 1
- 2
- 3
- 4
- 5
- 6
- 7
- 8
- 9
- 10