Angang Steel Company Limited's (HKG:347) 35% Price Boost Is Out Of Tune With Revenues
Angang Steel Company Limited (HKG:347) shareholders have had their patience rewarded with a 35% share price jump in the last month. Looking back a bit further, it's encouraging to see the stock is up 38% in the last year.
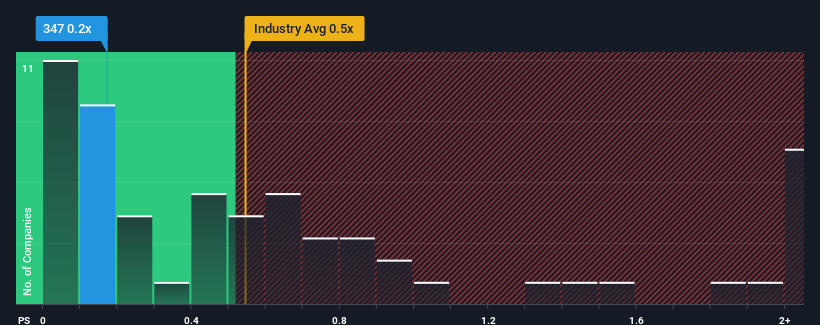
In spite of the firm bounce in price, it's still not a stretch to say that Angang Steel's price-to-sales (or "P/S") ratio of 0.2x right now seems quite "middle-of-the-road" compared to the Metals and Mining industry in Hong Kong, where the median P/S ratio is around 0.5x. While this might not raise any eyebrows, if the P/S ratio is not justified investors could be missing out on a potential opportunity or ignoring looming disappointment.
Check out our latest analysis for Angang Steel
What Does Angang Steel's Recent Performance Look Like?
Angang Steel hasn't been tracking well recently as its declining revenue compares poorly to other companies, which have seen some growth in their revenues on average. Perhaps the market is expecting its poor revenue performance to improve, keeping the P/S from dropping. You'd really hope so, otherwise you're paying a relatively elevated price for a company with this sort of growth profile.
Keen to find out how analysts think Angang Steel's future stacks up against the industry? In that case, our free report is a great place to start.Is There Some Revenue Growth Forecasted For Angang Steel?
There's an inherent assumption that a company should be matching the industry for P/S ratios like Angang Steel's to be considered reasonable.
Taking a look back first, the company's revenue growth last year wasn't something to get excited about as it posted a disappointing decline of 8.0%. This means it has also seen a slide in revenue over the longer-term as revenue is down 23% in total over the last three years. Accordingly, shareholders would have felt downbeat about the medium-term rates of revenue growth.
Shifting to the future, estimates from the seven analysts covering the company suggest revenue growth is heading into negative territory, declining 2.8% over the next year. That's not great when the rest of the industry is expected to grow by 15%.
With this in consideration, we think it doesn't make sense that Angang Steel's P/S is closely matching its industry peers. It seems most investors are hoping for a turnaround in the company's business prospects, but the analyst cohort is not so confident this will happen. There's a good chance these shareholders are setting themselves up for future disappointment if the P/S falls to levels more in line with the negative growth outlook.
What Does Angang Steel's P/S Mean For Investors?
Angang Steel appears to be back in favour with a solid price jump bringing its P/S back in line with other companies in the industry We'd say the price-to-sales ratio's power isn't primarily as a valuation instrument but rather to gauge current investor sentiment and future expectations.
It appears that Angang Steel currently trades on a higher than expected P/S for a company whose revenues are forecast to decline. When we see a gloomy outlook like this, our immediate thoughts are that the share price is at risk of declining, negatively impacting P/S. If we consider the revenue outlook, the P/S seems to indicate that potential investors may be paying a premium for the stock.
Many other vital risk factors can be found on the company's balance sheet. You can assess many of the main risks through our free balance sheet analysis for Angang Steel with six simple checks.
It's important to make sure you look for a great company, not just the first idea you come across. So if growing profitability aligns with your idea of a great company, take a peek at this free list of interesting companies with strong recent earnings growth (and a low P/E).
New: Manage All Your Stock Portfolios in One Place
We've created the ultimate portfolio companion for stock investors, and it's free.
• Connect an unlimited number of Portfolios and see your total in one currency• Be alerted to new Warning Signs or Risks via email or mobile• Track the Fair Value of your stocks
Try a Demo Portfolio for FreeHave feedback on this article? Concerned about the content? Get in touch with us directly. Alternatively, email editorial-team (at) simplywallst.com.This article by Simply Wall St is general in nature. We provide commentary based on historical data and analyst forecasts only using an unbiased methodology and our articles are not intended to be financial advice. It does not constitute a recommendation to buy or sell any stock, and does not take account of your objectives, or your financial situation. We aim to bring you long-term focused analysis driven by fundamental data. Note that our analysis may not factor in the latest price-sensitive company announcements or qualitative material. Simply Wall St has no position in any stocks mentioned.
免責聲明:投資有風險,本文並非投資建議,以上內容不應被視為任何金融產品的購買或出售要約、建議或邀請,作者或其他用戶的任何相關討論、評論或帖子也不應被視為此類內容。本文僅供一般參考,不考慮您的個人投資目標、財務狀況或需求。TTM對信息的準確性和完整性不承擔任何責任或保證,投資者應自行研究並在投資前尋求專業建議。
熱議股票
- 1
- 2
- 3
- 4
- 5
- 6
- 7
- 8
- 9
- 10