Calculating The Fair Value Of Nongfu Spring Co., Ltd. (HKG:9633)
Key Insights
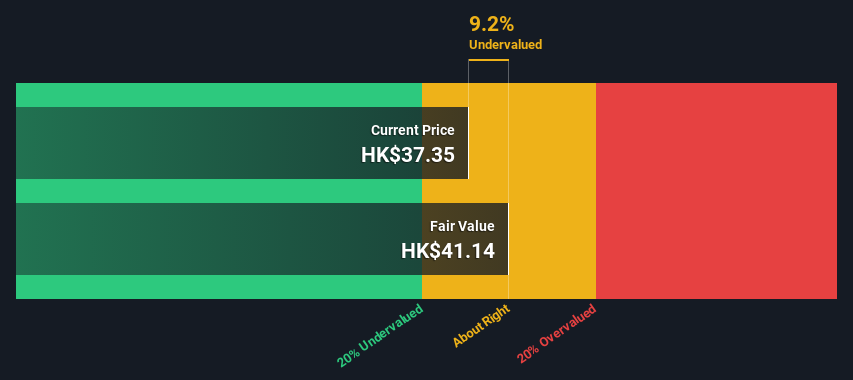
- Nongfu Spring's estimated fair value is HK$41.14 based on 2 Stage Free Cash Flow to Equity
- Nongfu Spring's HK$37.35 share price indicates it is trading at similar levels as its fair value estimate
- Our fair value estimate is 15% higher than Nongfu Spring's analyst price target of CN¥35.81
How far off is Nongfu Spring Co., Ltd. (HKG:9633) from its intrinsic value? Using the most recent financial data, we'll take a look at whether the stock is fairly priced by taking the forecast future cash flows of the company and discounting them back to today's value. Our analysis will employ the Discounted Cash Flow (DCF) model. Don't get put off by the jargon, the math behind it is actually quite straightforward.
We would caution that there are many ways of valuing a company and, like the DCF, each technique has advantages and disadvantages in certain scenarios. If you want to learn more about discounted cash flow, the rationale behind this calculation can be read in detail in the Simply Wall St analysis model.
See our latest analysis for Nongfu Spring
Crunching The Numbers
We're using the 2-stage growth model, which simply means we take in account two stages of company's growth. In the initial period the company may have a higher growth rate and the second stage is usually assumed to have a stable growth rate. To start off with, we need to estimate the next ten years of cash flows. Where possible we use analyst estimates, but when these aren't available we extrapolate the previous free cash flow (FCF) from the last estimate or reported value. We assume companies with shrinking free cash flow will slow their rate of shrinkage, and that companies with growing free cash flow will see their growth rate slow, over this period. We do this to reflect that growth tends to slow more in the early years than it does in later years.
A DCF is all about the idea that a dollar in the future is less valuable than a dollar today, so we need to discount the sum of these future cash flows to arrive at a present value estimate:
10-year free cash flow (FCF) forecast
| 2025 | 2026 | 2027 | 2028 | 2029 | 2030 | 2031 | 2032 | 2033 | 2034 | |
| Levered FCF (CN¥, Millions) | CN¥14.4b | CN¥16.1b | CN¥17.4b | CN¥18.5b | CN¥19.5b | CN¥20.3b | CN¥21.1b | CN¥21.8b | CN¥22.5b | CN¥23.1b |
| Growth Rate Estimate Source | Analyst x3 | Analyst x3 | Est @ 7.98% | Est @ 6.32% | Est @ 5.15% | Est @ 4.34% | Est @ 3.77% | Est @ 3.37% | Est @ 3.09% | Est @ 2.90% |
| Present Value (CN¥, Millions) Discounted @ 6.7% | CN¥13.5k | CN¥14.2k | CN¥14.4k | CN¥14.3k | CN¥14.1k | CN¥13.8k | CN¥13.4k | CN¥13.0k | CN¥12.6k | CN¥12.1k |
("Est" = FCF growth rate estimated by Simply Wall St)Present Value of 10-year Cash Flow (PVCF) = CN¥136b
After calculating the present value of future cash flows in the initial 10-year period, we need to calculate the Terminal Value, which accounts for all future cash flows beyond the first stage. For a number of reasons a very conservative growth rate is used that cannot exceed that of a country's GDP growth. In this case we have used the 5-year average of the 10-year government bond yield (2.4%) to estimate future growth. In the same way as with the 10-year 'growth' period, we discount future cash flows to today's value, using a cost of equity of 6.7%.
Terminal Value (TV)= FCF2034 × (1 + g) ÷ (r – g) = CN¥23b× (1 + 2.4%) ÷ (6.7%– 2.4%) = CN¥562b
Present Value of Terminal Value (PVTV)= TV / (1 + r)10= CN¥562b÷ ( 1 + 6.7%)10= CN¥295b
The total value, or equity value, is then the sum of the present value of the future cash flows, which in this case is CN¥431b. To get the intrinsic value per share, we divide this by the total number of shares outstanding. Compared to the current share price of HK$37.4, the company appears about fair value at a 9.2% discount to where the stock price trades currently. Valuations are imprecise instruments though, rather like a telescope - move a few degrees and end up in a different galaxy. Do keep this in mind.
The Assumptions
The calculation above is very dependent on two assumptions. The first is the discount rate and the other is the cash flows. If you don't agree with these result, have a go at the calculation yourself and play with the assumptions. The DCF also does not consider the possible cyclicality of an industry, or a company's future capital requirements, so it does not give a full picture of a company's potential performance. Given that we are looking at Nongfu Spring as potential shareholders, the cost of equity is used as the discount rate, rather than the cost of capital (or weighted average cost of capital, WACC) which accounts for debt. In this calculation we've used 6.7%, which is based on a levered beta of 0.800. Beta is a measure of a stock's volatility, compared to the market as a whole. We get our beta from the industry average beta of globally comparable companies, with an imposed limit between 0.8 and 2.0, which is a reasonable range for a stable business.
SWOT Analysis for Nongfu Spring
- Earnings growth over the past year exceeded the industry.
- Debt is not viewed as a risk.
- Balance sheet summary for 9633.
- Dividend is low compared to the top 25% of dividend payers in the Beverage market.
- Annual revenue is forecast to grow faster than the Hong Kong market.
- Current share price is below our estimate of fair value.
- Dividends are not covered by cash flow.
- Annual earnings are forecast to grow slower than the Hong Kong market.
- See 9633's dividend history.
Looking Ahead:
Valuation is only one side of the coin in terms of building your investment thesis, and it ideally won't be the sole piece of analysis you scrutinize for a company. It's not possible to obtain a foolproof valuation with a DCF model. Rather it should be seen as a guide to "what assumptions need to be true for this stock to be under/overvalued?" For instance, if the terminal value growth rate is adjusted slightly, it can dramatically alter the overall result. For Nongfu Spring, we've compiled three pertinent factors you should explore:
- Risks: To that end, you should be aware of the 1 warning sign we've spotted with Nongfu Spring .
- Future Earnings: How does 9633's growth rate compare to its peers and the wider market? Dig deeper into the analyst consensus number for the upcoming years by interacting with our free analyst growth expectation chart.
- Other Solid Businesses: Low debt, high returns on equity and good past performance are fundamental to a strong business. Why not explore our interactive list of stocks with solid business fundamentals to see if there are other companies you may not have considered!
PS. Simply Wall St updates its DCF calculation for every Hong Kong stock every day, so if you want to find the intrinsic value of any other stock just search here.
Valuation is complex, but we're here to simplify it.
Discover if Nongfu Spring might be undervalued or overvalued with our detailed analysis, featuring fair value estimates, potential risks, dividends, insider trades, and its financial condition.
Access Free AnalysisHave feedback on this article? Concerned about the content? Get in touch with us directly. Alternatively, email editorial-team (at) simplywallst.com.This article by Simply Wall St is general in nature. We provide commentary based on historical data and analyst forecasts only using an unbiased methodology and our articles are not intended to be financial advice. It does not constitute a recommendation to buy or sell any stock, and does not take account of your objectives, or your financial situation. We aim to bring you long-term focused analysis driven by fundamental data. Note that our analysis may not factor in the latest price-sensitive company announcements or qualitative material. Simply Wall St has no position in any stocks mentioned.
免責聲明:投資有風險,本文並非投資建議,以上內容不應被視為任何金融產品的購買或出售要約、建議或邀請,作者或其他用戶的任何相關討論、評論或帖子也不應被視為此類內容。本文僅供一般參考,不考慮您的個人投資目標、財務狀況或需求。TTM對信息的準確性和完整性不承擔任何責任或保證,投資者應自行研究並在投資前尋求專業建議。
熱議股票
- 1
- 2
- 3
- 4
- 5
- 6
- 7
- 8
- 9
- 10