Here's What's Concerning About NEXTDC's (ASX:NXT) Returns On Capital
Finding a business that has the potential to grow substantially is not easy, but it is possible if we look at a few key financial metrics. Firstly, we'd want to identify a growing return on capital employed (ROCE) and then alongside that, an ever-increasing base of capital employed. This shows us that it's a compounding machine, able to continually reinvest its earnings back into the business and generate higher returns. Having said that, from a first glance at NEXTDC (ASX:NXT) we aren't jumping out of our chairs at how returns are trending, but let's have a deeper look.
We've found 21 US stocks that are forecast to pay a dividend yield of over 6% next year. See the full list for free.
Understanding Return On Capital Employed (ROCE)
For those who don't know, ROCE is a measure of a company's yearly pre-tax profit (its return), relative to the capital employed in the business. Analysts use this formula to calculate it for NEXTDC:
Return on Capital Employed = Earnings Before Interest and Tax (EBIT) ÷ (Total Assets - Current Liabilities)
0.0028 = AU$14m ÷ (AU$5.2b - AU$139m) (Based on the trailing twelve months to December 2024).
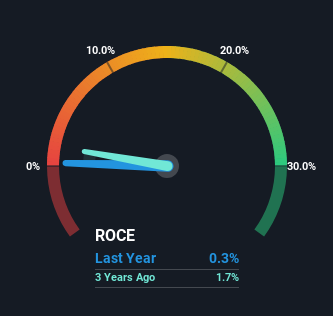
So, NEXTDC has an ROCE of 0.3%. In absolute terms, that's a low return and it also under-performs the IT industry average of 5.7%.
Check out our latest analysis for NEXTDC
Above you can see how the current ROCE for NEXTDC compares to its prior returns on capital, but there's only so much you can tell from the past. If you'd like, you can check out the forecasts from the analysts covering NEXTDC for free.
What Does the ROCE Trend For NEXTDC Tell Us?
Unfortunately, the trend isn't great with ROCE falling from 2.2% five years ago, while capital employed has grown 190%. Usually this isn't ideal, but given NEXTDC conducted a capital raising before their most recent earnings announcement, that would've likely contributed, at least partially, to the increased capital employed figure. NEXTDC probably hasn't received a full year of earnings yet from the new funds it raised, so these figures should be taken with a grain of salt.
The Bottom Line
To conclude, we've found that NEXTDC is reinvesting in the business, but returns have been falling. Although the market must be expecting these trends to improve because the stock has gained 69% over the last five years. Ultimately, if the underlying trends persist, we wouldn't hold our breath on it being a multi-bagger going forward.
One more thing: We've identified 3 warning signs with NEXTDC (at least 1 which shouldn't be ignored) , and understanding these would certainly be useful.
While NEXTDC isn't earning the highest return, check out this free list of companies that are earning high returns on equity with solid balance sheets.
Valuation is complex, but we're here to simplify it.
Discover if NEXTDC might be undervalued or overvalued with our detailed analysis, featuring fair value estimates, potential risks, dividends, insider trades, and its financial condition.
Access Free AnalysisHave feedback on this article? Concerned about the content? Get in touch with us directly. Alternatively, email editorial-team (at) simplywallst.com.This article by Simply Wall St is general in nature. We provide commentary based on historical data and analyst forecasts only using an unbiased methodology and our articles are not intended to be financial advice. It does not constitute a recommendation to buy or sell any stock, and does not take account of your objectives, or your financial situation. We aim to bring you long-term focused analysis driven by fundamental data. Note that our analysis may not factor in the latest price-sensitive company announcements or qualitative material. Simply Wall St has no position in any stocks mentioned.
免責聲明:投資有風險,本文並非投資建議,以上內容不應被視為任何金融產品的購買或出售要約、建議或邀請,作者或其他用戶的任何相關討論、評論或帖子也不應被視為此類內容。本文僅供一般參考,不考慮您的個人投資目標、財務狀況或需求。TTM對信息的準確性和完整性不承擔任何責任或保證,投資者應自行研究並在投資前尋求專業建議。
熱議股票
- 1
- 2
- 3
- 4
- 5
- 6
- 7
- 8
- 9
- 10