Can This Intricate XRP Chart Predict a Massive Breakout? Analyst Weighs In
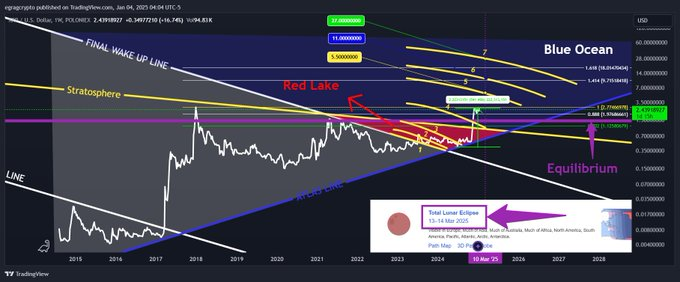
- Analyst’s chart uses Fibonacci arcs to map XRP’s potential price path
- “Red Lake” and “Blue Ocean” zones on the chart represent market behavior
- Technical analysis suggests XRP to potentially reach price targets ranging from $13 to $27
Crypto analyst EGRAGCrypto has released their latest “XRP Bermuda Triangle” chart, presenting a detailed technical analysis that combines Fibonacci arcs and symbolic zones to project XRP’s future price movements.
The chart tracks XRP’s progression through seven significant Fibonacci arcs. As of January 2025, XRP has moved past the first four arcs, indicating a change in market momentum. Price is now navigating between arcs five and seven, with each arc potentially acting as a resistance or acceleration area. The month of March is crucial when these arcs converge, suggesting increased volatility.
Related: XRP’s Counter-Narrative: Challenging Bitcoin’s Institutional Dominance Towards $200K
What Do the “Red Lake” and “Blue Ocean” Zones Signify for XRP?
The Bermuda Triangle structure incorporates symbolic zones that reflect the psychology of XRP traders and overall market sentiment.
…The post Can This Intricate XRP Chart Predict a Massive Breakout? Analyst Weighs In appeared first on Coin Edition.
免責聲明:投資有風險,本文並非投資建議,以上內容不應被視為任何金融產品的購買或出售要約、建議或邀請,作者或其他用戶的任何相關討論、評論或帖子也不應被視為此類內容。本文僅供一般參考,不考慮您的個人投資目標、財務狀況或需求。TTM對信息的準確性和完整性不承擔任何責任或保證,投資者應自行研究並在投資前尋求專業建議。
熱議股票
- 1
- 2
- 3
- 4
- 5
- 6
- 7
- 8
- 9
- 10