Ethereum price could crash 25% as on-chain metrics disappoint 7 seconds ago
Ethereum price has crashed by over 52% from its highest level in December, and technicals and on-chain metrics point to more downside in the near term.
Ethereum (ETH) peaked at $4,105 in December and was trading at $1,970 on March 20. This 52% crash makes it one of the worst-performing blue-chip coins in the market.
Ether has crashed as concerns about its future remain. Just this week, Standard Chartered analysts downgraded their estimate by 60% from $10,000 to $4,000, citing the rising competition from layer-1 and layer-2 networks that have affected its revenue growth.
Layer-2 networks on Ethereum, like Coinbase’s Base, Arbitrum, and Optimism, have drawn more users to their ecosystems because of their lower fees. For example, DeFi Llama’s data shows that DEX Ethereum protocols handled over $9.8 billion in volume in the last seven days.
Arbitrum handled $2.87 billion, while Base had $2.8 billion. In the past, this volume would have been handled on Ethereum’s mainnet network.
Ethereum is also seeing intensified competition from layer-1 networks like Solana (SOL) and BNB Chain. BNB Smart Chain’s DEX protocols handled DEX volume worth over $13 billion in the last seven days.
Ethereum is also not expected to be a major beneficiary of emerging technologies like Real World Asset tokenization because of its higher fees and slower speed. Instead, developers may opt to use other scalable and cheaper networks like Mantra (OM) and BNB Chain.
Ethereum has weak on-chain metrics
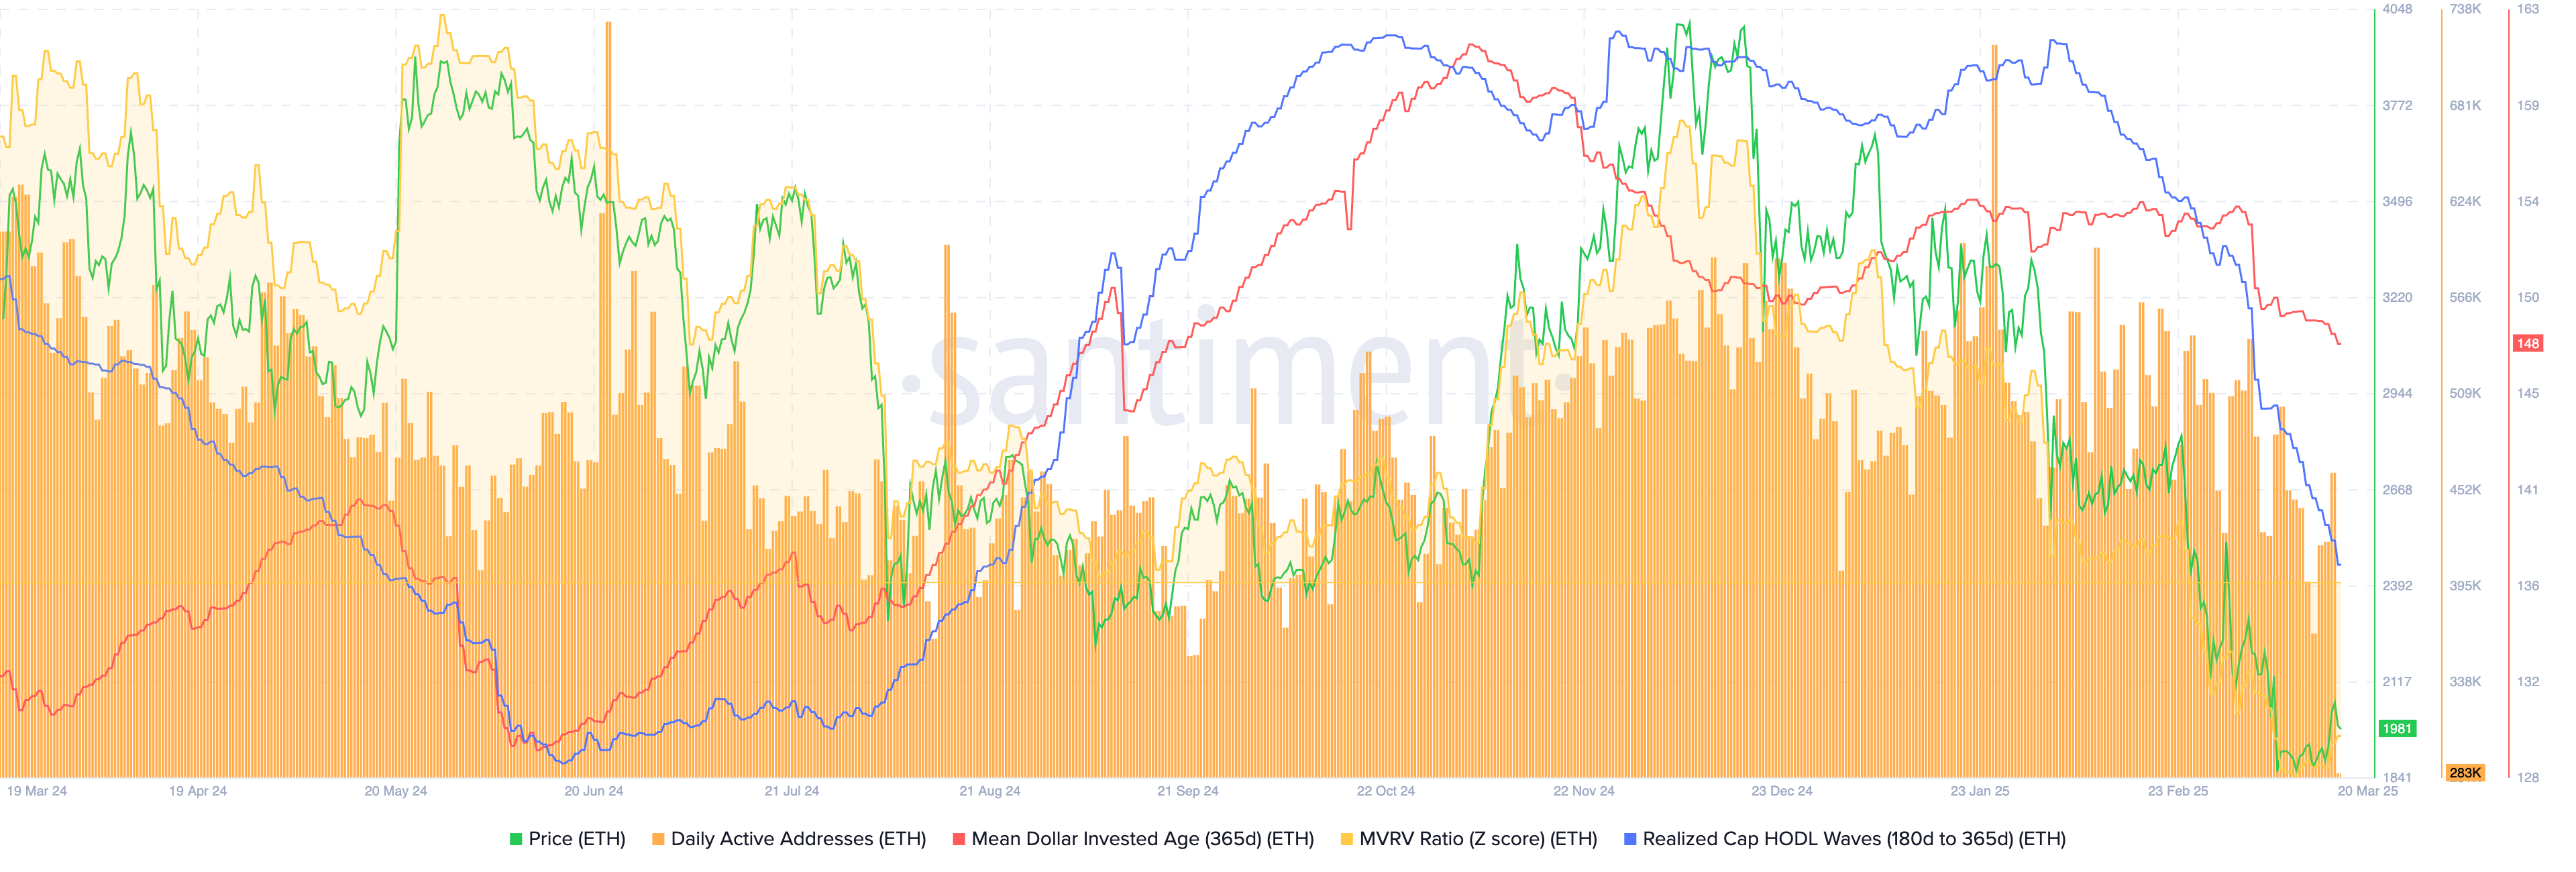
More data shows that the number of active addresses on Ethereum has declined in the past few months. The chart below from Santiment shows that Ethereum had 461,000 active addresses on Wednesday, down from 717,000 earlier this year.
Another notable data point is Ethereum’s realized cap HODL wave, which is shown in blue. It has crashed to the lowest point since August last year, a sign that long-term holders have started to sell.
The 365-day mean dollar invested age or MDIA, which calculates the duration that each coin has stayed in an address and all the money used to buy it, has dropped to its September lows.

Ethereum price technical analysis

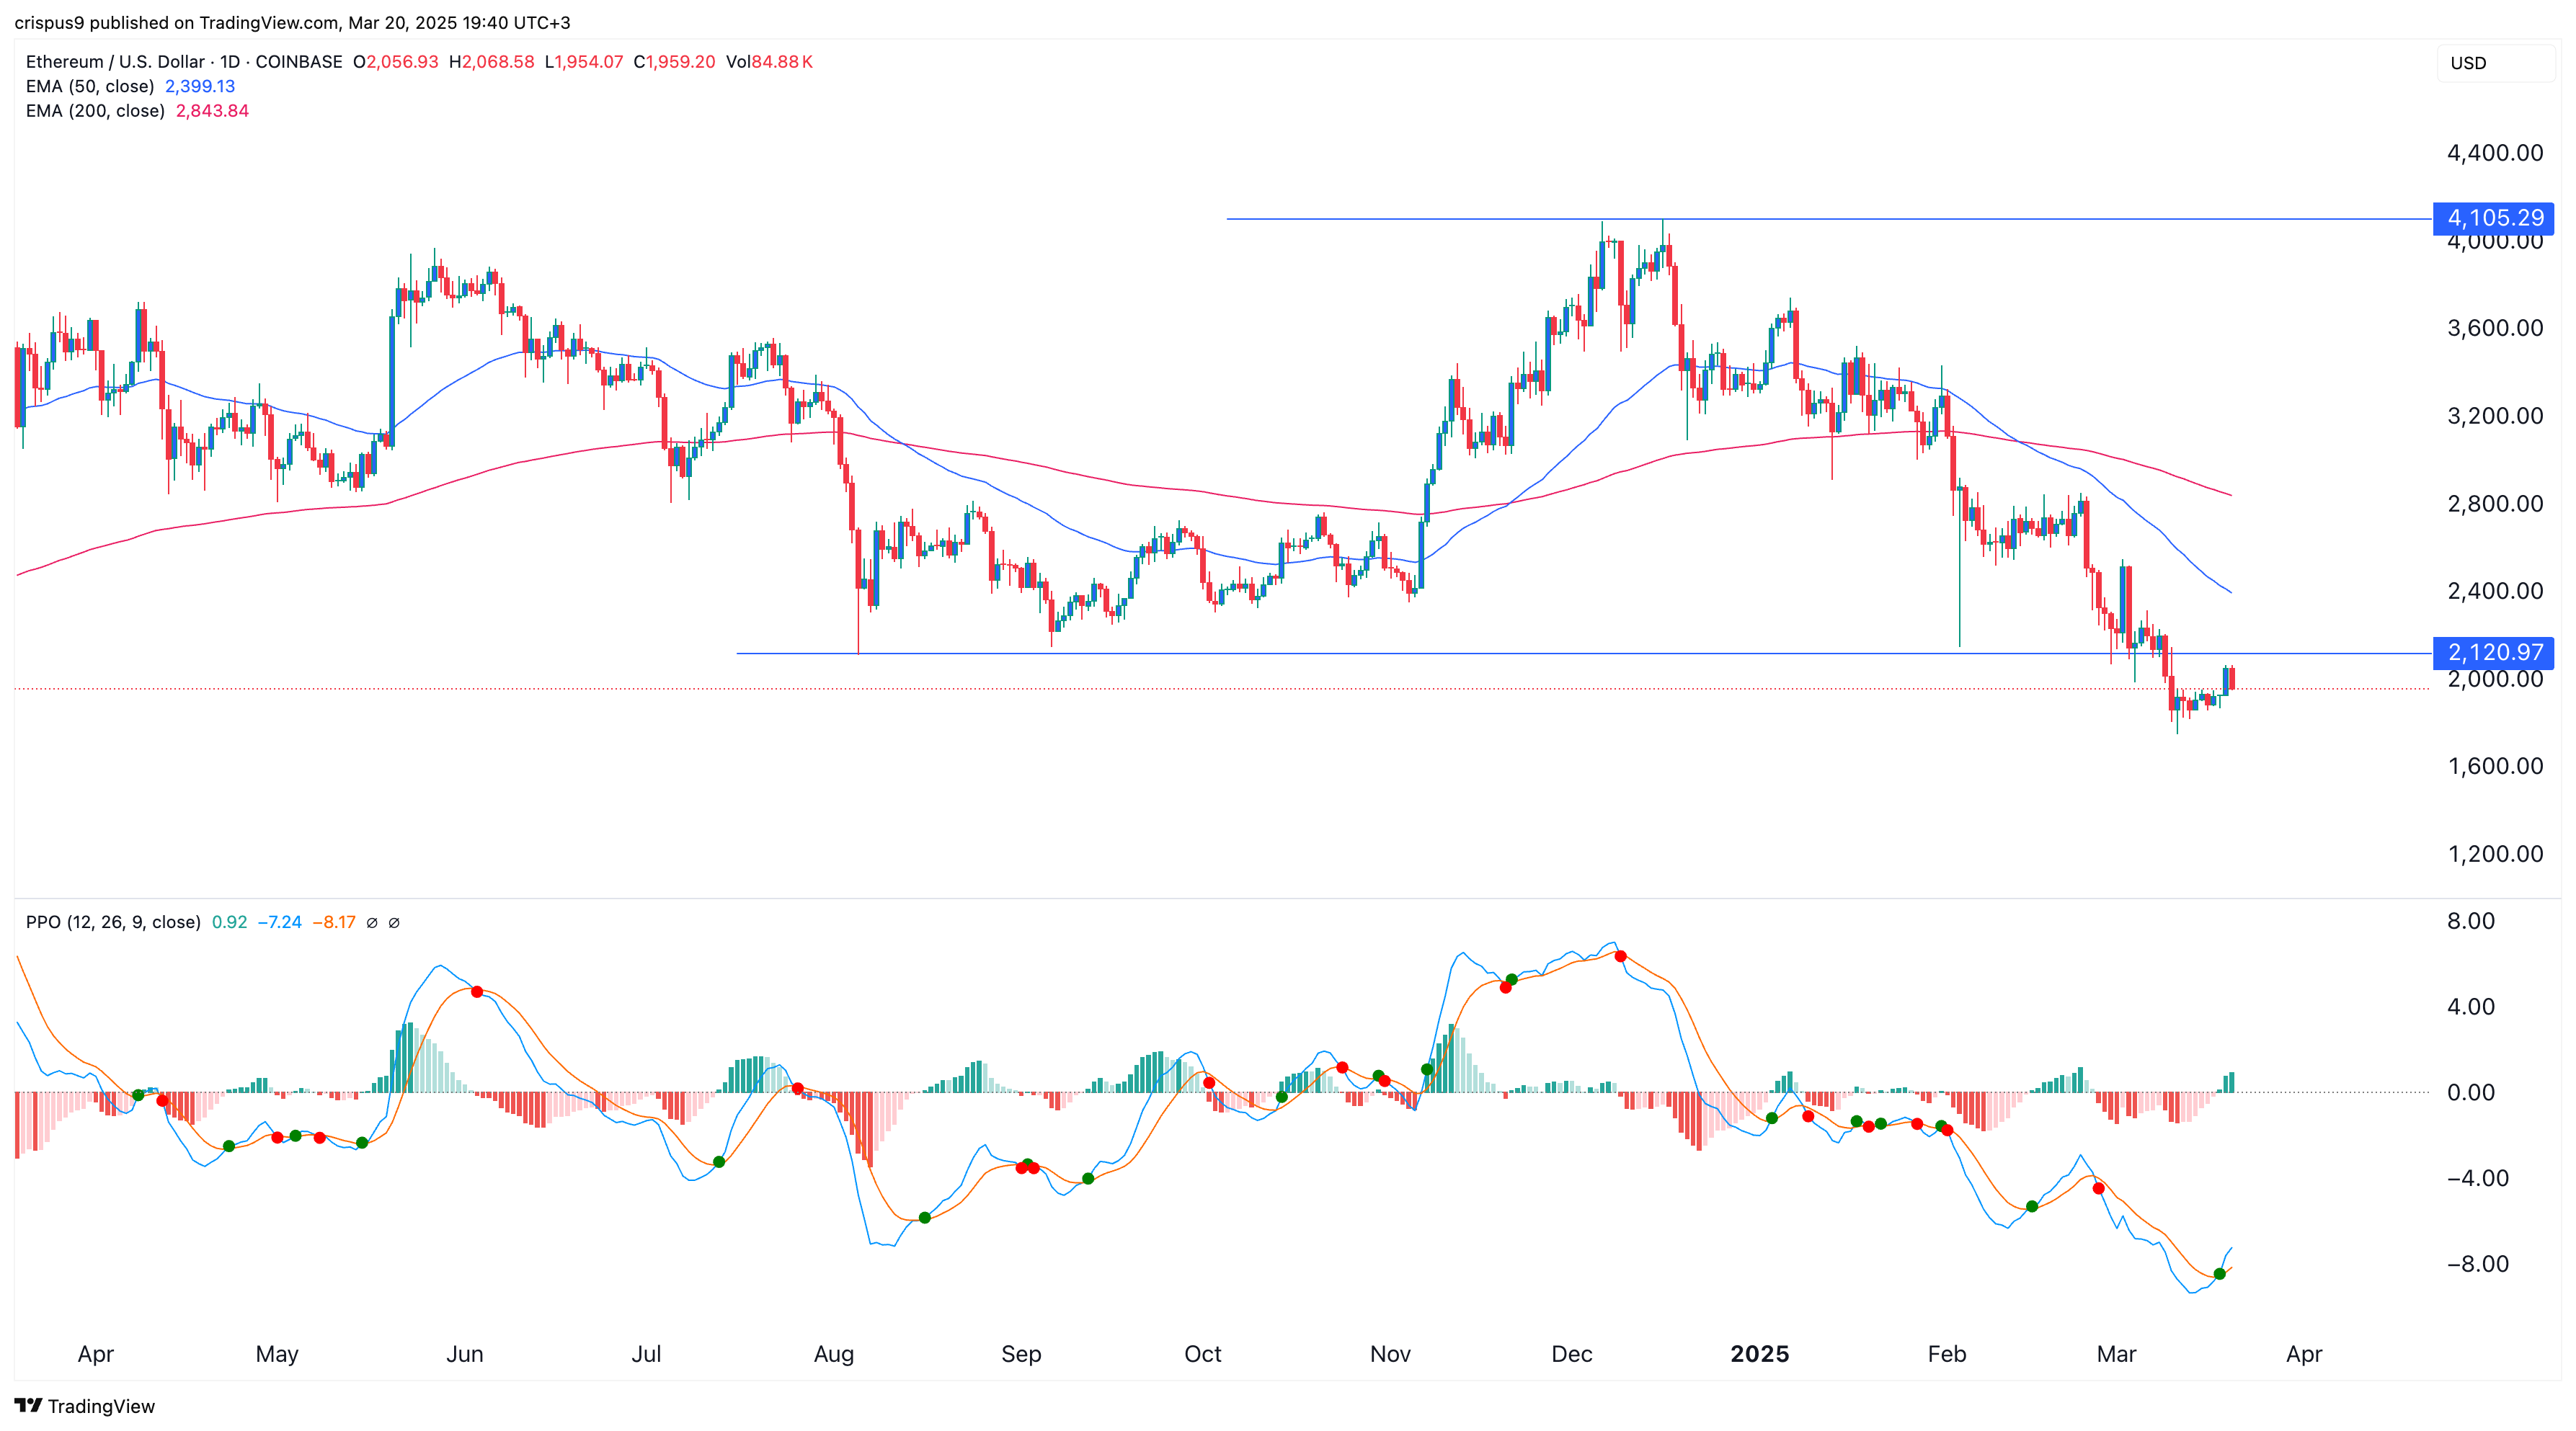
The daily chart shows that the ETH price has been in a strong downward trend over the past few months. This drop started after it formed a triple-top pattern at $4,000, with the neckline at $2,120.
Ether then formed a death cross pattern as the 50-day and 200-day moving averages crossed each other. This cross often leads to more downside momentum. Also, popular oscillators like the Relative Strength Index and Percentage Price Oscillator have dropped.
Therefore, the coin will likely continue falling as sellers target the psychological point at $1,500, which is about 25% below the current level.
免責聲明:投資有風險,本文並非投資建議,以上內容不應被視為任何金融產品的購買或出售要約、建議或邀請,作者或其他用戶的任何相關討論、評論或帖子也不應被視為此類內容。本文僅供一般參考,不考慮您的個人投資目標、財務狀況或需求。TTM對信息的準確性和完整性不承擔任何責任或保證,投資者應自行研究並在投資前尋求專業建議。
熱議股票
- 1
- 2
- 3
- 4
- 5
- 6
- 7
- 8
- 9
- 10