Sheng Tang Holdings Limited (HKG:8305) May Have Run Too Fast Too Soon With Recent 27% Price Plummet
Sheng Tang Holdings Limited (HKG:8305) shares have retraced a considerable 27% in the last month, reversing a fair amount of their solid recent performance. Nonetheless, the last 30 days have barely left a scratch on the stock's annual performance, which is up a whopping 375%.
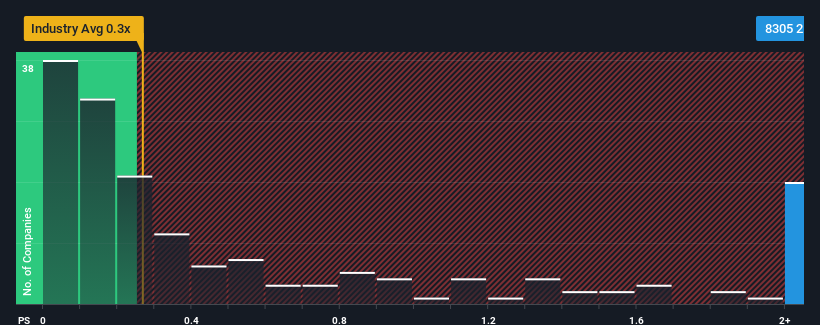
Even after such a large drop in price, given around half the companies in Hong Kong's Construction industry have price-to-sales ratios (or "P/S") below 0.3x, you may still consider Sheng Tang Holdings as a stock to avoid entirely with its 2.4x P/S ratio. However, the P/S might be quite high for a reason and it requires further investigation to determine if it's justified.
AI is about to change healthcare. These 20 stocks are working on everything from early diagnostics to drug discovery. The best part - they are all under $10bn in marketcap - there is still time to get in early.
See our latest analysis for Sheng Tang Holdings
How Has Sheng Tang Holdings Performed Recently?
Sheng Tang Holdings has been doing a decent job lately as it's been growing revenue at a reasonable pace. It might be that many expect the reasonable revenue performance to beat most other companies over the coming period, which has increased investors’ willingness to pay up for the stock. You'd really hope so, otherwise you're paying a pretty hefty price for no particular reason.
Want the full picture on earnings, revenue and cash flow for the company? Then our free report on Sheng Tang Holdings will help you shine a light on its historical performance.What Are Revenue Growth Metrics Telling Us About The High P/S?
There's an inherent assumption that a company should far outperform the industry for P/S ratios like Sheng Tang Holdings' to be considered reasonable.
Retrospectively, the last year delivered a decent 4.6% gain to the company's revenues. Still, lamentably revenue has fallen 2.7% in aggregate from three years ago, which is disappointing. So unfortunately, we have to acknowledge that the company has not done a great job of growing revenue over that time.
Comparing that to the industry, which is predicted to deliver 6.6% growth in the next 12 months, the company's downward momentum based on recent medium-term revenue results is a sobering picture.
With this information, we find it concerning that Sheng Tang Holdings is trading at a P/S higher than the industry. It seems most investors are ignoring the recent poor growth rate and are hoping for a turnaround in the company's business prospects. There's a very good chance existing shareholders are setting themselves up for future disappointment if the P/S falls to levels more in line with the recent negative growth rates.
What Does Sheng Tang Holdings' P/S Mean For Investors?
Sheng Tang Holdings' shares may have suffered, but its P/S remains high. It's argued the price-to-sales ratio is an inferior measure of value within certain industries, but it can be a powerful business sentiment indicator.
Our examination of Sheng Tang Holdings revealed its shrinking revenue over the medium-term isn't resulting in a P/S as low as we expected, given the industry is set to grow. When we see revenue heading backwards and underperforming the industry forecasts, we feel the possibility of the share price declining is very real, bringing the P/S back into the realm of reasonability. Unless the recent medium-term conditions improve markedly, investors will have a hard time accepting the share price as fair value.
And what about other risks? Every company has them, and we've spotted 4 warning signs for Sheng Tang Holdings (of which 2 are potentially serious!) you should know about.
Of course, profitable companies with a history of great earnings growth are generally safer bets. So you may wish to see this free collection of other companies that have reasonable P/E ratios and have grown earnings strongly.
If you're looking to trade Sheng Tang Holdings, open an account with the lowest-cost platform trusted by professionals, Interactive Brokers.
With clients in over 200 countries and territories, and access to 160 markets, IBKR lets you trade stocks, options, futures, forex, bonds and funds from a single integrated account.
Enjoy no hidden fees, no account minimums, and FX conversion rates as low as 0.03%, far better than what most brokers offer.
Sponsored ContentNew: Manage All Your Stock Portfolios in One Place
We've created the ultimate portfolio companion for stock investors, and it's free.
• Connect an unlimited number of Portfolios and see your total in one currency• Be alerted to new Warning Signs or Risks via email or mobile• Track the Fair Value of your stocks
Try a Demo Portfolio for FreeHave feedback on this article? Concerned about the content? Get in touch with us directly. Alternatively, email editorial-team (at) simplywallst.com.This article by Simply Wall St is general in nature. We provide commentary based on historical data and analyst forecasts only using an unbiased methodology and our articles are not intended to be financial advice. It does not constitute a recommendation to buy or sell any stock, and does not take account of your objectives, or your financial situation. We aim to bring you long-term focused analysis driven by fundamental data. Note that our analysis may not factor in the latest price-sensitive company announcements or qualitative material. Simply Wall St has no position in any stocks mentioned.
免責聲明:投資有風險,本文並非投資建議,以上內容不應被視為任何金融產品的購買或出售要約、建議或邀請,作者或其他用戶的任何相關討論、評論或帖子也不應被視為此類內容。本文僅供一般參考,不考慮您的個人投資目標、財務狀況或需求。TTM對信息的準確性和完整性不承擔任何責任或保證,投資者應自行研究並在投資前尋求專業建議。
熱議股票
- 1
- 2
- 3
- 4
- 5
- 6
- 7
- 8
- 9
- 10