Earnings Tell The Story For Sichuan Baicha Baidao Industrial Co., Ltd. (HKG:2555)
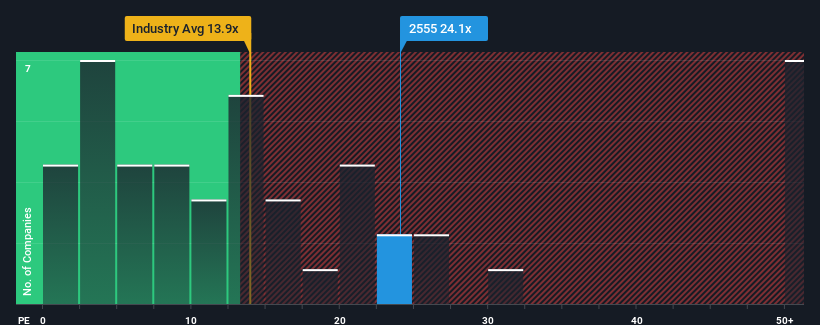
When close to half the companies in Hong Kong have price-to-earnings ratios (or "P/E's") below 9x, you may consider Sichuan Baicha Baidao Industrial Co., Ltd. (HKG:2555) as a stock to avoid entirely with its 24.1x P/E ratio. However, the P/E might be quite high for a reason and it requires further investigation to determine if it's justified.
AI is about to change healthcare. These 20 stocks are working on everything from early diagnostics to drug discovery. The best part - they are all under $10bn in marketcap - there is still time to get in early.
Sichuan Baicha Baidao Industrial hasn't been tracking well recently as its declining earnings compare poorly to other companies, which have seen some growth on average. One possibility is that the P/E is high because investors think this poor earnings performance will turn the corner. You'd really hope so, otherwise you're paying a pretty hefty price for no particular reason.
View our latest analysis for Sichuan Baicha Baidao Industrial
How Is Sichuan Baicha Baidao Industrial's Growth Trending?
The only time you'd be truly comfortable seeing a P/E as steep as Sichuan Baicha Baidao Industrial's is when the company's growth is on track to outshine the market decidedly.
Taking a look back first, the company's earnings per share growth last year wasn't something to get excited about as it posted a disappointing decline of 66%. The last three years don't look nice either as the company has shrunk EPS by 58% in aggregate. Therefore, it's fair to say the earnings growth recently has been undesirable for the company.
Turning to the outlook, the next three years should generate growth of 26% per annum as estimated by the only analyst watching the company. With the market only predicted to deliver 14% each year, the company is positioned for a stronger earnings result.
In light of this, it's understandable that Sichuan Baicha Baidao Industrial's P/E sits above the majority of other companies. It seems most investors are expecting this strong future growth and are willing to pay more for the stock.
What We Can Learn From Sichuan Baicha Baidao Industrial's P/E?
While the price-to-earnings ratio shouldn't be the defining factor in whether you buy a stock or not, it's quite a capable barometer of earnings expectations.
We've established that Sichuan Baicha Baidao Industrial maintains its high P/E on the strength of its forecast growth being higher than the wider market, as expected. At this stage investors feel the potential for a deterioration in earnings isn't great enough to justify a lower P/E ratio. It's hard to see the share price falling strongly in the near future under these circumstances.
Having said that, be aware Sichuan Baicha Baidao Industrial is showing 2 warning signs in our investment analysis, you should know about.
If P/E ratios interest you, you may wish to see this free collection of other companies with strong earnings growth and low P/E ratios.
If you're looking to trade Sichuan Baicha Baidao Industrial, open an account with the lowest-cost platform trusted by professionals, Interactive Brokers.
With clients in over 200 countries and territories, and access to 160 markets, IBKR lets you trade stocks, options, futures, forex, bonds and funds from a single integrated account.
Enjoy no hidden fees, no account minimums, and FX conversion rates as low as 0.03%, far better than what most brokers offer.
Sponsored ContentNew: Manage All Your Stock Portfolios in One Place
We've created the ultimate portfolio companion for stock investors, and it's free.
• Connect an unlimited number of Portfolios and see your total in one currency• Be alerted to new Warning Signs or Risks via email or mobile• Track the Fair Value of your stocks
Try a Demo Portfolio for FreeHave feedback on this article? Concerned about the content? Get in touch with us directly. Alternatively, email editorial-team (at) simplywallst.com.This article by Simply Wall St is general in nature. We provide commentary based on historical data and analyst forecasts only using an unbiased methodology and our articles are not intended to be financial advice. It does not constitute a recommendation to buy or sell any stock, and does not take account of your objectives, or your financial situation. We aim to bring you long-term focused analysis driven by fundamental data. Note that our analysis may not factor in the latest price-sensitive company announcements or qualitative material. Simply Wall St has no position in any stocks mentioned.
免責聲明:投資有風險,本文並非投資建議,以上內容不應被視為任何金融產品的購買或出售要約、建議或邀請,作者或其他用戶的任何相關討論、評論或帖子也不應被視為此類內容。本文僅供一般參考,不考慮您的個人投資目標、財務狀況或需求。TTM對信息的準確性和完整性不承擔任何責任或保證,投資者應自行研究並在投資前尋求專業建議。
熱議股票
- 1
- 2
- 3
- 4
- 5
- 6
- 7
- 8
- 9
- 10