Bumitama Agri's (SGX:P8Z) earnings growth rate lags the 22% CAGR delivered to shareholders
Bumitama Agri Ltd. (SGX:P8Z) shareholders might be concerned after seeing the share price drop 10% in the last month. But that doesn't change the fact that the returns over the last five years have been pleasing. After all, the share price is up a market-beating 85% in that time.
In light of the stock dropping 7.5% in the past week, we want to investigate the longer term story, and see if fundamentals have been the driver of the company's positive five-year return.
We've found 21 US stocks that are forecast to pay a dividend yield of over 6% next year. See the full list for free.
In his essay The Superinvestors of Graham-and-Doddsville Warren Buffett described how share prices do not always rationally reflect the value of a business. One imperfect but simple way to consider how the market perception of a company has shifted is to compare the change in the earnings per share (EPS) with the share price movement.
During five years of share price growth, Bumitama Agri achieved compound earnings per share (EPS) growth of 27% per year. This EPS growth is higher than the 13% average annual increase in the share price. So one could conclude that the broader market has become more cautious towards the stock. This cautious sentiment is reflected in its (fairly low) P/E ratio of 7.62.
You can see below how EPS has changed over time (discover the exact values by clicking on the image).
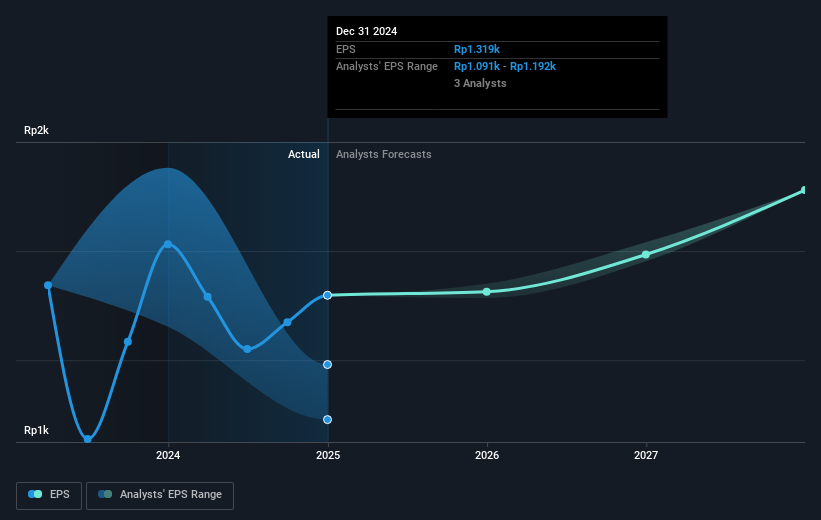
Dive deeper into Bumitama Agri's key metrics by checking this interactive graph of Bumitama Agri's earnings, revenue and cash flow .
What About Dividends?
It is important to consider the total shareholder return, as well as the share price return, for any given stock. The TSR incorporates the value of any spin-offs or discounted capital raisings, along with any dividends, based on the assumption that the dividends are reinvested. It's fair to say that the TSR gives a more complete picture for stocks that pay a dividend. As it happens, Bumitama Agri's TSR for the last 5 years was 165%, which exceeds the share price return mentioned earlier. And there's no prize for guessing that the dividend payments largely explain the divergence!
A Different Perspective
It's good to see that Bumitama Agri has rewarded shareholders with a total shareholder return of 18% in the last twelve months. Of course, that includes the dividend. Having said that, the five-year TSR of 22% a year, is even better. It's always interesting to track share price performance over the longer term. But to understand Bumitama Agri better, we need to consider many other factors. To that end, you should be aware of the 1 warning sign we've spotted with Bumitama Agri .
But note: Bumitama Agri may not be the best stock to buy. So take a peek at this free list of interesting companies with past earnings growth (and further growth forecast).
Please note, the market returns quoted in this article reflect the market weighted average returns of stocks that currently trade on Singaporean exchanges.
If you're looking to trade Bumitama Agri, open an account with the lowest-cost platform trusted by professionals, Interactive Brokers.
With clients in over 200 countries and territories, and access to 160 markets, IBKR lets you trade stocks, options, futures, forex, bonds and funds from a single integrated account.
Enjoy no hidden fees, no account minimums, and FX conversion rates as low as 0.03%, far better than what most brokers offer.
Sponsored ContentValuation is complex, but we're here to simplify it.
Discover if Bumitama Agri might be undervalued or overvalued with our detailed analysis, featuring fair value estimates, potential risks, dividends, insider trades, and its financial condition.
Access Free AnalysisHave feedback on this article? Concerned about the content? Get in touch with us directly. Alternatively, email editorial-team (at) simplywallst.com.This article by Simply Wall St is general in nature. We provide commentary based on historical data and analyst forecasts only using an unbiased methodology and our articles are not intended to be financial advice. It does not constitute a recommendation to buy or sell any stock, and does not take account of your objectives, or your financial situation. We aim to bring you long-term focused analysis driven by fundamental data. Note that our analysis may not factor in the latest price-sensitive company announcements or qualitative material. Simply Wall St has no position in any stocks mentioned.
免責聲明:投資有風險,本文並非投資建議,以上內容不應被視為任何金融產品的購買或出售要約、建議或邀請,作者或其他用戶的任何相關討論、評論或帖子也不應被視為此類內容。本文僅供一般參考,不考慮您的個人投資目標、財務狀況或需求。TTM對信息的準確性和完整性不承擔任何責任或保證,投資者應自行研究並在投資前尋求專業建議。
熱議股票
- 1
- 2
- 3
- 4
- 5
- 6
- 7
- 8
- 9
- 10