Sichuan Kelun-Biotech Biopharmaceutical Co., Ltd.'s (HKG:6990) 27% Price Boost Is Out Of Tune With Revenues
Despite an already strong run, Sichuan Kelun-Biotech Biopharmaceutical Co., Ltd. (HKG:6990) shares have been powering on, with a gain of 27% in the last thirty days. The last month tops off a massive increase of 107% in the last year.
Since its price has surged higher, Sichuan Kelun-Biotech Biopharmaceutical may be sending very bearish signals at the moment with a price-to-sales (or "P/S") ratio of 33.3x, since almost half of all companies in the Biotechs industry in Hong Kong have P/S ratios under 8.7x and even P/S lower than 4x are not unusual. Nonetheless, we'd need to dig a little deeper to determine if there is a rational basis for the highly elevated P/S.
We've found 21 US stocks that are forecast to pay a dividend yield of over 6% next year. See the full list for free.
Check out our latest analysis for Sichuan Kelun-Biotech Biopharmaceutical
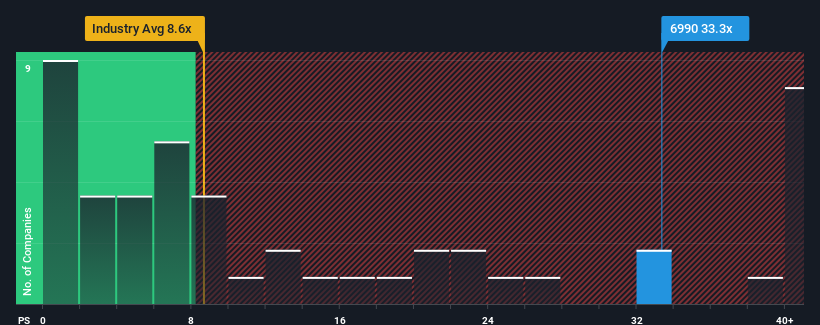
How Sichuan Kelun-Biotech Biopharmaceutical Has Been Performing
Recent times haven't been great for Sichuan Kelun-Biotech Biopharmaceutical as its revenue has been rising slower than most other companies. Perhaps the market is expecting future revenue performance to undergo a reversal of fortunes, which has elevated the P/S ratio. You'd really hope so, otherwise you're paying a pretty hefty price for no particular reason.
If you'd like to see what analysts are forecasting going forward, you should check out our free report on Sichuan Kelun-Biotech Biopharmaceutical .What Are Revenue Growth Metrics Telling Us About The High P/S?
In order to justify its P/S ratio, Sichuan Kelun-Biotech Biopharmaceutical would need to produce outstanding growth that's well in excess of the industry.
Taking a look back first, we see that the company grew revenue by an impressive 25% last year. This great performance means it was also able to deliver immense revenue growth over the last three years. Therefore, it's fair to say the revenue growth recently has been superb for the company.
Shifting to the future, estimates from the analysts covering the company suggest revenue should grow by 35% per annum over the next three years. That's shaping up to be materially lower than the 49% each year growth forecast for the broader industry.
With this information, we find it concerning that Sichuan Kelun-Biotech Biopharmaceutical is trading at a P/S higher than the industry. It seems most investors are hoping for a turnaround in the company's business prospects, but the analyst cohort is not so confident this will happen. Only the boldest would assume these prices are sustainable as this level of revenue growth is likely to weigh heavily on the share price eventually.
The Bottom Line On Sichuan Kelun-Biotech Biopharmaceutical's P/S
Sichuan Kelun-Biotech Biopharmaceutical's P/S has grown nicely over the last month thanks to a handy boost in the share price. Generally, our preference is to limit the use of the price-to-sales ratio to establishing what the market thinks about the overall health of a company.
Despite analysts forecasting some poorer-than-industry revenue growth figures for Sichuan Kelun-Biotech Biopharmaceutical, this doesn't appear to be impacting the P/S in the slightest. Right now we aren't comfortable with the high P/S as the predicted future revenues aren't likely to support such positive sentiment for long. This places shareholders' investments at significant risk and potential investors in danger of paying an excessive premium.
The company's balance sheet is another key area for risk analysis. Take a look at our free balance sheet analysis for Sichuan Kelun-Biotech Biopharmaceutical with six simple checks on some of these key factors.
If companies with solid past earnings growth is up your alley, you may wish to see this free collection of other companies with strong earnings growth and low P/E ratios.
If you're looking to trade Sichuan Kelun-Biotech Biopharmaceutical, open an account with the lowest-cost platform trusted by professionals, Interactive Brokers.
With clients in over 200 countries and territories, and access to 160 markets, IBKR lets you trade stocks, options, futures, forex, bonds and funds from a single integrated account.
Enjoy no hidden fees, no account minimums, and FX conversion rates as low as 0.03%, far better than what most brokers offer.
Sponsored ContentNew: Manage All Your Stock Portfolios in One Place
We've created the ultimate portfolio companion for stock investors, and it's free.
• Connect an unlimited number of Portfolios and see your total in one currency• Be alerted to new Warning Signs or Risks via email or mobile• Track the Fair Value of your stocks
Try a Demo Portfolio for FreeHave feedback on this article? Concerned about the content? Get in touch with us directly. Alternatively, email editorial-team (at) simplywallst.com.This article by Simply Wall St is general in nature. We provide commentary based on historical data and analyst forecasts only using an unbiased methodology and our articles are not intended to be financial advice. It does not constitute a recommendation to buy or sell any stock, and does not take account of your objectives, or your financial situation. We aim to bring you long-term focused analysis driven by fundamental data. Note that our analysis may not factor in the latest price-sensitive company announcements or qualitative material. Simply Wall St has no position in any stocks mentioned.
免責聲明:投資有風險,本文並非投資建議,以上內容不應被視為任何金融產品的購買或出售要約、建議或邀請,作者或其他用戶的任何相關討論、評論或帖子也不應被視為此類內容。本文僅供一般參考,不考慮您的個人投資目標、財務狀況或需求。TTM對信息的準確性和完整性不承擔任何責任或保證,投資者應自行研究並在投資前尋求專業建議。
熱議股票
- 1
- 2
- 3
- 4
- 5
- 6
- 7
- 8
- 9
- 10