This Chart Pattern Could Send Ethena (ENA) Price Up 78% – Here’s Why
Ethena (ENA) is starting to catch traders’ eyes again, and for good reason. The price of ENA is forming a classic chart setup that usually hints at a potential reversal. At the same time, crypto expert Captain Faibik has shared his bullish take on ENA, saying he’s aiming for a midterm target of $0.75.
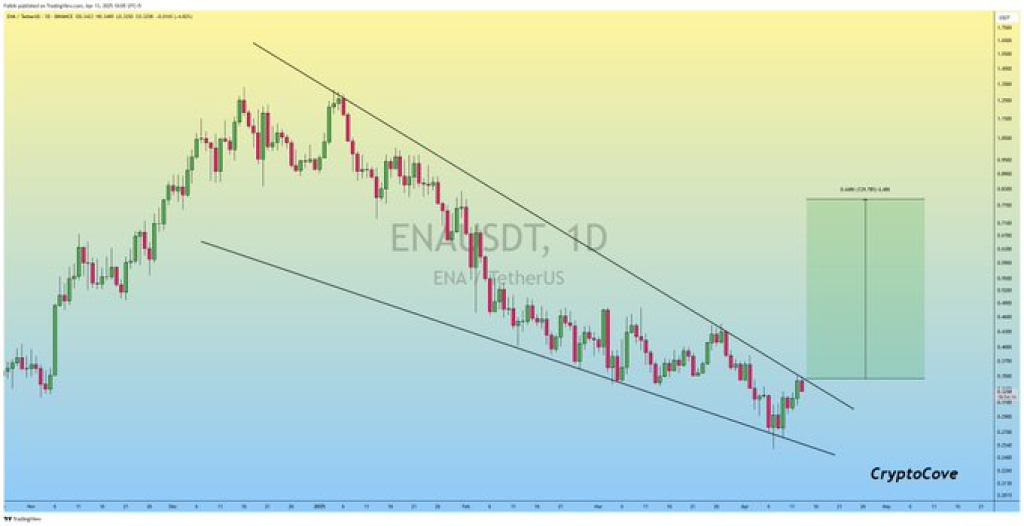
So, what’s going on with the chart? ENA price has been moving inside a falling wedge, that’s when two downward-sloping trendlines start to squeeze together. It’s a setup that often shows up right before a breakout to the upside.
After bouncing off the lower wedge support, ENA has been climbing steadily toward resistance. Right now, Ethena price is testing that upper boundary, and early signs are pointing toward a potential breakout. If it manages to push through with solid volume and a strong daily close, that could confirm the move. For many traders, this type of pattern is a go-to signal for a bullish reversal.
Ethena Price Targets and Support Zones
The projected move from this wedge, if confirmed, points toward a price near $0.75. This aligns with the height of the wedge pattern and past price consolidation zones. From the current breakout level around $0.42, this represents an estimated 78% gain.
Immediate support levels are located between $0.36 and $0.38. These levels mark the recent bounce point and serve as a cushion in the event of a failed breakout. The confirmation zone for a continued move is between $0.43 and $0.44, which would indicate a stronger bullish structure.
Moreover, Captain Faibik shared his view on the ENA price chart. In his post, he stated, “ENA Bottomed out & is on the Verge of Wedge Breakout.. I’m Still Bullish on it & Holding my bag…
 Midterm Target: $0.75.”
His comment has gained traction in the trading community. The tweet reflects confidence in the pattern’s validity and supports the midterm target identified through chart analysis.
Read Also: Here’s Why Helium (HNT) Price Is Pumping
Ethena Market Outlook and Risk Levels
While current momentum favors a potential breakout, traders continue to monitor for volume confirmation. The $0.44 zone remains critical for validating the pattern. Failure to sustain above this level could lead to a pullback toward the $0.36 support range.
Ethena price structure and technical context indicate that it may be entering a new phase of price discovery. Traders are awaiting a daily close above the resistance line to confirm breakout strength. The next few sessions may prove pivotal in determining the asset’s short-to-midterm trajectory.
Follow us on X (Twitter), CoinMarketCap and Binance Square for more daily crypto updates.Get all our future calls by joining our FREE Telegram group.
We recommend eToro
Wide range of assets: cryptocurrencies alongside other investment products such as stocks and ETFs.
Copy trading: allows users to copy the trades of leading traders, for free.
User-friendly: eToro’s web-based platform and mobile app are user-friendly and easy to navigate.
The post This Chart Pattern Could Send Ethena (ENA) Price Up 78% – Here’s Why appeared first on CaptainAltcoin.
免責聲明:投資有風險,本文並非投資建議,以上內容不應被視為任何金融產品的購買或出售要約、建議或邀請,作者或其他用戶的任何相關討論、評論或帖子也不應被視為此類內容。本文僅供一般參考,不考慮您的個人投資目標、財務狀況或需求。TTM對信息的準確性和完整性不承擔任何責任或保證,投資者應自行研究並在投資前尋求專業建議。
熱議股票
- 1
- 2
- 3
- 4
- 5
- 6
- 7
- 8
- 9
- 10