Ebix (NASDAQ:EBIX) earnings and shareholder returns have been trending downwards for the last five years, but the stock pops 12% this past week
This week we saw the Ebix, Inc. (NASDAQ:EBIX) share price climb by 12%. But will that heal all the wounds inflicted over 5 years of declines? Unlikely. Five years have seen the share price descend precipitously, down a full 88%. While the recent increase might be a green shoot, we're certainly hesitant to rejoice. The million dollar question is whether the company can justify a long term recovery. We really hope anyone holding through that price crash has a diversified portfolio. Even when you lose money, you don't have to lose the lesson.
While the last five years has been tough for Ebix shareholders, this past week has shown signs of promise. So let's look at the longer term fundamentals and see if they've been the driver of the negative returns.
Check out our latest analysis for Ebix
While markets are a powerful pricing mechanism, share prices reflect investor sentiment, not just underlying business performance. By comparing earnings per share (EPS) and share price changes over time, we can get a feel for how investor attitudes to a company have morphed over time.
Looking back five years, both Ebix's share price and EPS declined; the latter at a rate of 20% per year. Readers should note that the share price has fallen faster than the EPS, at a rate of 35% per year, over the period. This implies that the market was previously too optimistic about the stock. The less favorable sentiment is reflected in its current P/E ratio of 5.72.
You can see below how EPS has changed over time (discover the exact values by clicking on the image).
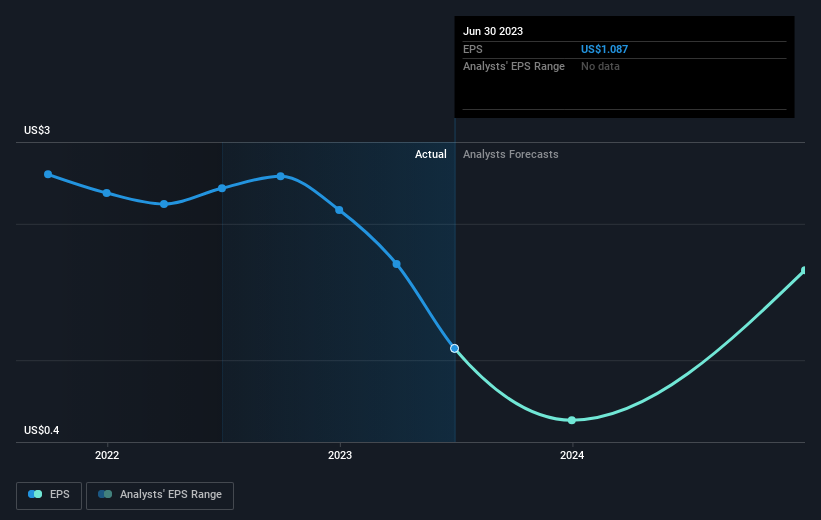
Before buying or selling a stock, we always recommend a close examination of historic growth trends, available here.
A Different Perspective
Investors in Ebix had a tough year, with a total loss of 65%, against a market gain of about 16%. Even the share prices of good stocks drop sometimes, but we want to see improvements in the fundamental metrics of a business, before getting too interested. Unfortunately, last year's performance may indicate unresolved challenges, given that it was worse than the annualised loss of 13% over the last half decade. Generally speaking long term share price weakness can be a bad sign, though contrarian investors might want to research the stock in hope of a turnaround. It's always interesting to track share price performance over the longer term. But to understand Ebix better, we need to consider many other factors. Consider for instance, the ever-present spectre of investment risk. We've identified 3 warning signs with Ebix (at least 2 which are a bit unpleasant) , and understanding them should be part of your investment process.
Of course Ebix may not be the best stock to buy. So you may wish to see this free collection of growth stocks.
Please note, the market returns quoted in this article reflect the market weighted average returns of stocks that currently trade on American exchanges.
What are the risks and opportunities for Ebix?
NasdaqGS:EBIX
Ebix
Ebix, Inc., together with its subsidiaries, provides on-demand infrastructure software exchanges and e-commerce services to the insurance, financial, travel, cash remittance, and healthcare industries in the United States and internationally.
Rewards
Trading at 56.6% below our estimate of its fair value
Earnings are forecast to grow 43.76% per year
Risks
Interest payments are not well covered by earnings
Highly volatile share price over the past 3 months
Profit margins (3.8%) are lower than last year (7%)
Share Price
Market Cap
1Y Return
Further research onEbix
ValuationFinancial HealthInsider TradingManagement TeamHave feedback on this article? Concerned about the content? Get in touch with us directly. Alternatively, email editorial-team (at) simplywallst.com.This article by Simply Wall St is general in nature. We provide commentary based on historical data and analyst forecasts only using an unbiased methodology and our articles are not intended to be financial advice. It does not constitute a recommendation to buy or sell any stock, and does not take account of your objectives, or your financial situation. We aim to bring you long-term focused analysis driven by fundamental data. Note that our analysis may not factor in the latest price-sensitive company announcements or qualitative material. Simply Wall St has no position in any stocks mentioned.
Disclaimer: Investing carries risk. This is not financial advice. The above content should not be regarded as an offer, recommendation, or solicitation on acquiring or disposing of any financial products, any associated discussions, comments, or posts by author or other users should not be considered as such either. It is solely for general information purpose only, which does not consider your own investment objectives, financial situations or needs. TTM assumes no responsibility or warranty for the accuracy and completeness of the information, investors should do their own research and may seek professional advice before investing.
Most Discussed
- 1
- 2
- 3
- 4
- 5
- 6
- 7
- 8
- 9
- 10