USD/CAD Teeters Near Critical Support Ahead Of Canadian Inflation Data
- USD/CAD is approaching a crucial support zone above 1.3600 ahead of Canadian inflation data.
- The loonie has strengthened recently due to rising oil prices and USD weakness.
- Upcoming Canadian inflation and retail sales data, along with Fed policymakers' statements, will be crucial for USD/CAD's direction.
vitapix/E+ via Getty Images
By Zain Vawda
USD/CAD has approached a crucial support zone just above the 1.3600 level in anticipation of Tuesday’s Canadian inflation data. The loonie has gained in recent weeks due to rising WTI oil prices and significant USD weakness.
The Canadian economy has been under the microscope over the past few months, experiencing signs of stagnation. This period saw a rise in unemployment, although inflation has eased to the latest year-over-year figure of around 2.7%, matching the year’s lowest print.
Inflation Rate YoY (Source: TradingEconomics)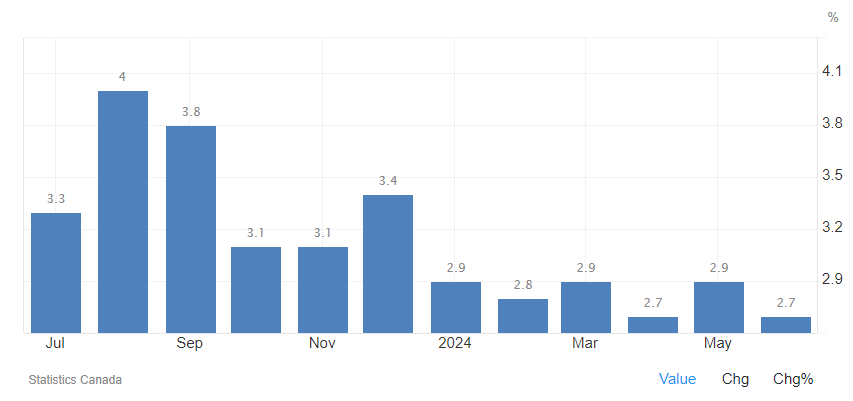
Considering the increased unemployment rate and the decline in retail sales, among other data points, the Bank of Canada (BoC) will be keen to prevent an inflation uptick. Such an event would complicate matters further for the Canadian Central Bank, which has already reduced rates by 50 basis points this cycle and may cut more if economic growth remains sluggish.
Therefore, avoiding an inflation rise will likely be a top priority for the BoC before the next Central Bank meeting.
Canadian Inflation and Retail Sales Data Ahead
Canadian inflation data is set to be released on Tuesday, followed by statements from several Federal Reserve policymakers. The recent dovish stance from Fed officials has pressured the US dollar since Friday, continuing into Monday’s session with the DXY hitting new lows.
Friday’s retail sales data will be equally crucial, especially since the poor May figures raised fears of a potential recession. The Bank of Canada is hoping for a notable improvement in June as the impact of rate cuts begins to manifest.
Source: MarketPulse Economic Calendar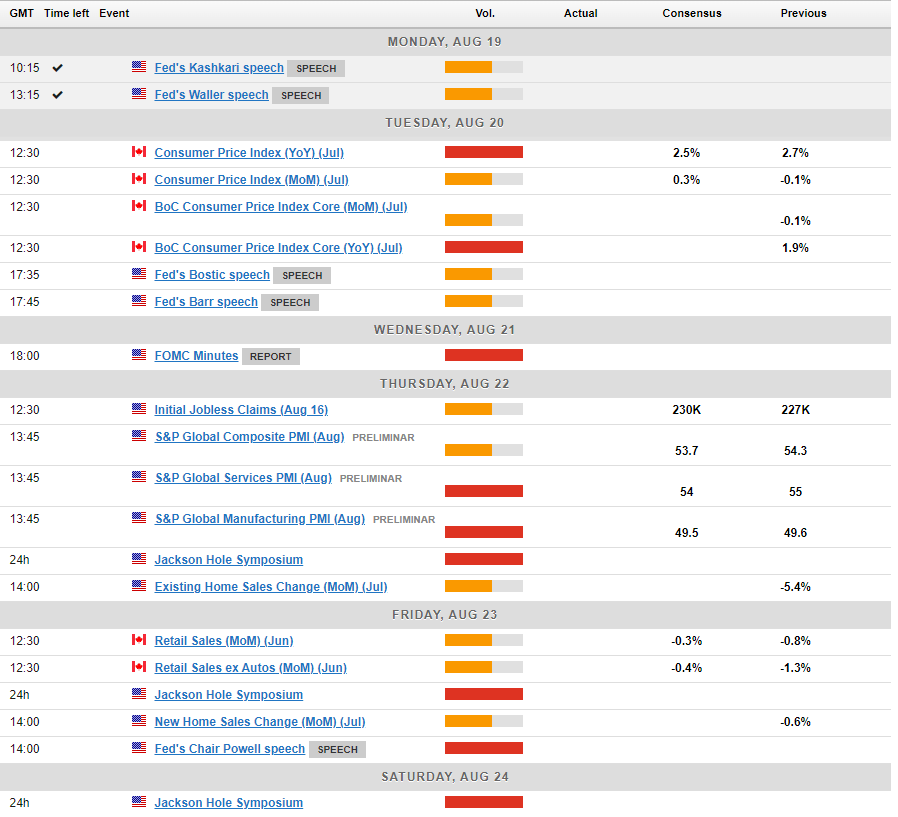
Technical Analysis
From a technical standpoint, USD/CAD has experienced a sharp decline from the August 5th high of around 1.3900. The descent has been accelerated by fundamental data and the evolving rate cut environment, pushing USD/CAD down more rapidly than usual.
A wedge pattern was breached when the price broke through the 1.3900 level, but the lower boundary of this wedge aligns with a crucial support zone near the 1.3600 mark.
Additionally, the 200-day moving average is situated around this level, creating a significant confluence zone that is theoretically expected to offer support.
Tuesday’s inflation data could drive the pair in either direction, depending on the outcome, while the DXY will also play a pivotal role in determining the next move for the USD/CAD.
USD/CAD Chart, August 19, 2024 (Source: TradingView)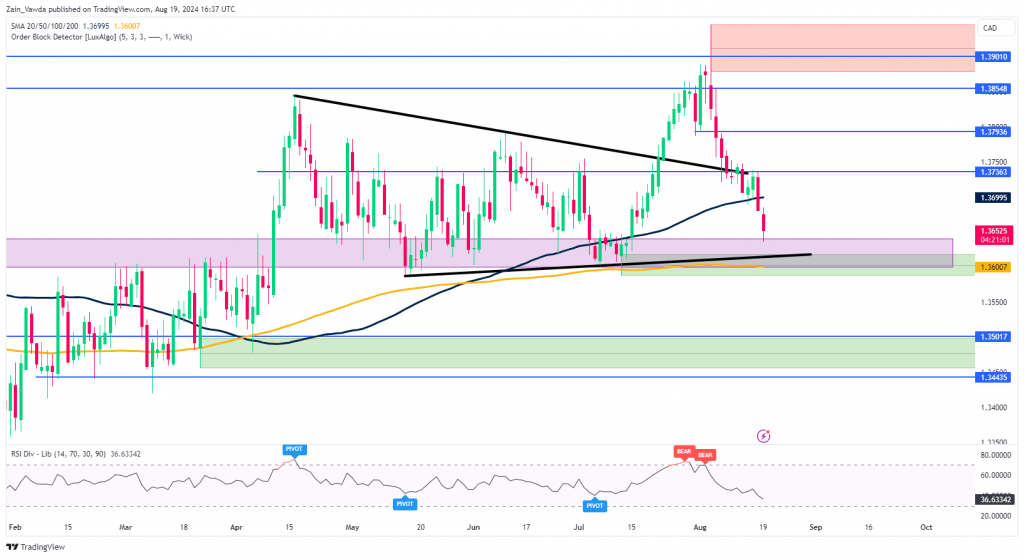
Support
- 1.3600
- 1.3550
- 1.3500
Resistance
- 1.3699 (100-day MA)
- 1.3736
- 1.3790
Original Post
Disclaimer: Investing carries risk. This is not financial advice. The above content should not be regarded as an offer, recommendation, or solicitation on acquiring or disposing of any financial products, any associated discussions, comments, or posts by author or other users should not be considered as such either. It is solely for general information purpose only, which does not consider your own investment objectives, financial situations or needs. TTM assumes no responsibility or warranty for the accuracy and completeness of the information, investors should do their own research and may seek professional advice before investing.
Most Discussed
- 1
- 2
- 3
- 4
- 5
- 6
- 7
- 8
- 9
- 10