DGRO: This Dividend Growth ETF Has Outperformed The S&P500 With Less Risk And More Yield
Guido Mieth
Dividends can be a powerful tool to acquire a growing income stream over time, when the companies providing them are high quality and provide competitive long-term returns to the overall market. Dividends are not guaranteed returns and their payment is a transfer of value from a company to its shareholders. However, any company that retains earnings must allocate its capital and dividends are an indispensable way to accomplish that.
The iShares Core Dividend Growth ETF (NYSEARCA:DGRO) offers a portfolio of 412 companies that has outperformed the S&P 500 over a ten-year time period, while slightly underperforming the index over time horizons shorter than five-years. As nearly all the holdings are companies from the S&P 500, DGRO conceptually is best considered as an 'equal weighted S&P 500 minus non-dividend payers fund.' Conceptually this is an interesting investing approach because over long time periods the methodology has outperformed the index, with lower volatility and increased dividend yield.
At this stage of the bull market, DGRO is attractive due to its diversification and lower volatility compared to the market. The fund is extremely 'vanilla,' but is an excellent way for income oriented investors to track the performance of the S&P 500.
Total Return: DGRO vs. S&P500 (Seeking Alpha)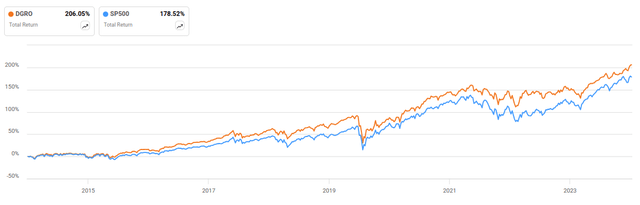
DGRO has a trailing dividend yield of 2.26% vs. 1.30% for the S&P 500 index and a trailing P/E ratio of 21.4x vs 26.6x for the index. There is a subtle form of value investing occurring that surprised me since a large majority of the stocks in DGRO are included in the S&P 500. Furthermore, with a beta of 0.82 DGRO is significantly less volatile than the overall market.
I have long been intrigued by the low volatility anomaly, a statistical anomaly wherein the least volatile stocks on the market tend to outperform the most volatile stocks on the market. Therefore, DGRO appears to have a statistical advantage over the S&P 500 in terms of value, yield and volatility.
Portfolio Characteristics for DGRO (Blackrock.com)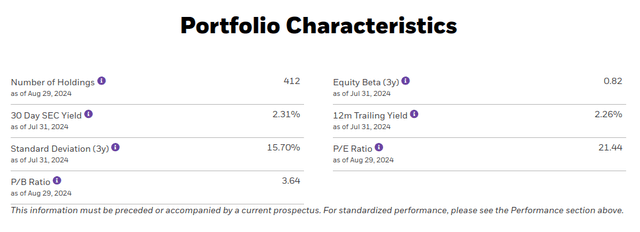
The top 15 holdings of DGRO are presented below. These and all holdings constituting 1% or more of the portfolio are members of the S&P 500. There are some smaller holdings (AGCO for example) that are mid-caps and not S&P 500 constituents.
There are two other major differences: first, no individual company represents more than 3.1% of the fund's holdings. Four companies in the S&P 500 exceed that: Apple (AAPL) at 7.04%, Microsoft (MSFT) at 6.52%, Nvidia (NVDA) at 6.15% and Amazon (AMZN) at 3.35%. As a result, the fund is less concentrated in its top holdings.
The second difference is that a number of non-dividend payers are excluded, among the largest these include: Nvidia (NVDA) and Amazon (AMZN), but also Alphabet (GOOG, GOOGL), Meta (META), Berkshire Hathaway (BRK.B) and Tesla (TSLA).
DGRO: Top Holdings (Blackrock.com)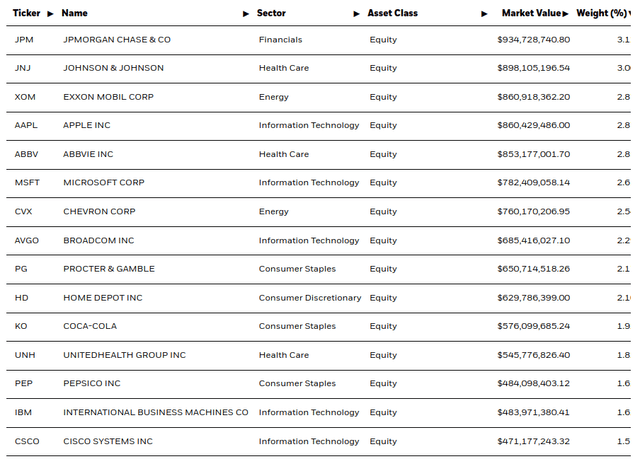
Furthermore, DGRO has a more balanced exposure to a broad number of sectors compared to the S&P 500. It is overweight several sectors compared to the S&P 500. Financials - 18.35% vs. 13.00%, health care - 17.94% vs. 11.90%, industrials - 11.70% vs. 8.40% and energy 7.31% vs. 3.70%. This is offset by being considerably underweight information technology - 16.01% vs. 31.40%.
If the technology rally continues, DGRO could lag slightly. However, performance in the past several years has been very competitive with the S&P 500. The fund therefore seems like a good compromise for investors who do not want to miss out on the bull market, but wish to allocate cautiously.
Exposure By Sector for DGRO (Blackrock.com)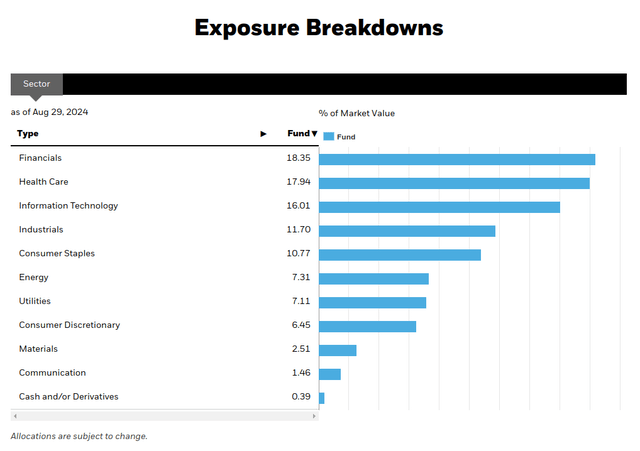
Since inception 9 years ago, DGRO has steadily grown its payout. Investing 9 years back, the yield was comparable to now. However, with share price growth and dividend growth the yield on cost would be approximately 5.5%. Over 5 years, DGRO has increased its dividend by a 9.30% CAGR.
DGRO Yield On Cost (Seeking Alpha)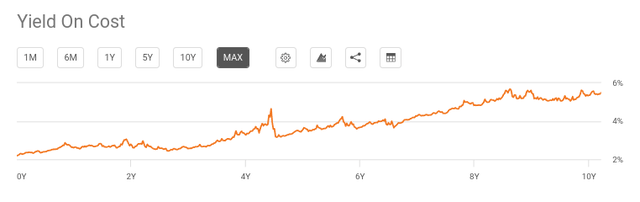
Conclusions
DGRO is an intriguing fund because while it mimics the performance of the S&P 500, it also deviated from it in ways that are likely to outpace the index, while still delivering similar performance to it. Though excluding some of the higher priced growth names, the price per dollar of earnings is approximately 20% less and dividend income is over 70% more per dollar invested. There is significantly lower volatility and lower concentration risk, as no single company represents more than 3.1% of the fund. Because the S&P 500 firms overweight this amount are due to size, the average market capitalization of a firm in the fund is reduced.
In this way DGRO is taking advantage of several anomalies likely to predict advantageous performance:
- Value Anomaly: Lower P/E stocks tend to outperform higher P/E stocks.
- Low Beta Anomaly: Lower beta stocks tend to outperform higher beta stocks.
- Dividend Anomaly: Stocks that pay dividends tend to outperform those that do not.
- Size Anomaly: Smaller firms tend to outperform larger firms.
With its 412 constituents, DGRO constructs a portfolio that presents these advantageous characteristics while deviating from the S&P 500 index as little as possible. It is great proxy for income investors who want to track the S&P 500, achieving a balance of diversification, dividend growth and capital appreciation.
Disclaimer: Investing carries risk. This is not financial advice. The above content should not be regarded as an offer, recommendation, or solicitation on acquiring or disposing of any financial products, any associated discussions, comments, or posts by author or other users should not be considered as such either. It is solely for general information purpose only, which does not consider your own investment objectives, financial situations or needs. TTM assumes no responsibility or warranty for the accuracy and completeness of the information, investors should do their own research and may seek professional advice before investing.
Most Discussed
- 1
- 2
- 3
- 4
- 5
- 6
- 7
- 8
- 9
- 10