QGRW Has A Short Yet Encouraging Track Record
GOCMEN
QGRW strategy
WisdomTree U.S. Quality Growth Fund ETF (NYSEARCA:QGRW) was launched on 12/15/2022 and tracks the WisdomTree U.S. Quality Growth Index. It has 100 holdings, a 30-day SEC yield of 0.22%, and an expense ratio of 0.28%. As described by WisdomTree, QGRW methodology starts with the 500 largest U.S. companies by market capitalization, and ranks them on a score combining growth and quality in equal weight. The top 100 companies are included in the underlying index. The growth factor is calculated from the median analyst earnings growth forecast (50%), trailing 5-year EBITDA growth (25%) and trailing 5-year sales growth (25%). The quality factor is calculated from the trailing 3-year average return on equity (50%) and trailing 3-year average return on assets (50%). Due to the focus on the 500 largest U.S. companies, this article will use as a benchmark the S&P 500 index, represented by SPDR S&P 500 ETF Trust (SPY).
QGRW portfolio
The portfolio is overweight in mega-cap companies (about 62% of asset value) and in the information technology sector (52.4% of assets). Other sectors are below 15%. Compared to the benchmark, QGRW overweights technology, and to a lesser extent consumer discretionary and communication services. It underweights all other sectors, totally ignoring real estate and utilities, and with a marginal allocation in materials, consumer staples, energy and industrials (each below 3%).
QGRW sector breakdown (Chart: author; data: WisdomTree, SSGA)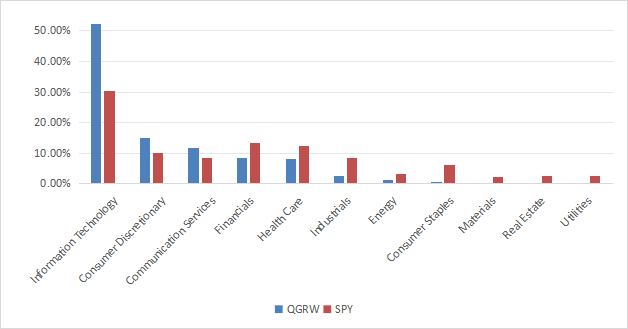
The portfolio is very concentrated: the top 10 issuers, listed in the next table with growth metrics, weigh 59.5% of asset value. The top 3 holdings (Apple, Microsoft, NVIDIA) weigh over 10% individually and 32% in aggregate.
Ticker | Name | Weight% | EPS growth %TTM | EPS growth %5Y | Sales Growth %TTM | Sales Growth %5Y |
AAPL | Apple, Inc. | 11.40% | 10.38 | 15.55 | 0.44 | 7.59 |
MSFT | Microsoft Corp. | 10.49% | 21.86 | 18.45 | 15.67 | 14.33 |
NVDA | NVIDIA Corp. | 10.24% | 414.59 | 48.40 | 194.69 | 39.06 |
LLY | Eli Lilly and Co. | 5.58% | 12.95 | 13.74 | 31.87 | 9.69 |
AMZN | Amazon.com, Inc. | 5.37% | 231.89 | 23.55 | 12.32 | 19.80 |
GOOGL | Alphabet, Inc. | 3.84% | 47.48 | 21.56 | 13.82 | 17.53 |
META | Meta Platforms, Inc. | 3.76% | 128.32 | 14.46 | 24.28 | 19.29 |
TSLA | Tesla, Inc. | 3.30% | 1.02 | 67.74 | 1.37 | 35.15 |
AVGO | Broadcom Inc. | 2.90% | -64.55 | 2.37 | 32.04 | 11.43 |
V | Visa, Inc. | 2.57% | 18.89 | 13.80 | 9.70 | 9.64 |
Fundamentals
QGRW is much more expensive than the benchmark regarding valuation ratios, as reported in the next table. It has better growth rates, in line with the strategy description.
QGRW | SPY | |
P/E TTM | 36.56 | 26.44 |
Price/Book | 11.18 | 4.64 |
Price/Sales | 7.47 | 3.06 |
Price/Cash Flow | 26.14 | 18.22 |
Earnings growth | 29.53% | 22.37% |
Sales growth % | 13.08% | 8.79% |
Cash flow growth % | 14.65% | 8.99% |
Data source: Fidelity
In my ETF reviews, risky stocks are companies with at least two red flags among: bad Piotroski score, negative ROA, unsustainable payout ratio, bad or dubious Altman Z-score, excluding financials and real estate where these metrics are unreliable. With this assumption, risky stocks weigh 7.8% of asset value, which is a good point. Additionally, according to my calculation of quality metrics (reported in the next table), portfolio quality is significantly superior to the benchmark. The aggregate return on assets is especially impressive.
QGRW | SPY | |
Atman Z-score | 15.73 | 3.79 |
Piotroski F-score | 6.43 | 5.98 |
ROA % TTM | 23.34 | 7.26 |
Performance
Since its inception in December 2022, QGRW has outperformed SPY by 32% in total return, as reported below. Obviously, a track record covering less than 2 years in a strong bull market is not enough to assess the long-term potential of the strategy.
QGRW vs SPY, total return since inception (Seeking Alpha)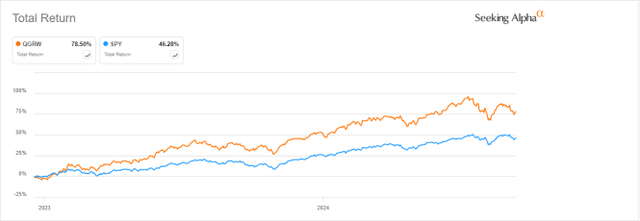
QGRW vs. competitors
The next table compares characteristics of QGRW and five popular growth ETFs focused on large companies:
- Invesco QQQ Trust ETF (QQQ)
- Schwab U.S. Large-Cap Growth ETF (SCHG)
- Vanguard Growth ETF (VUG)
- SPDR Portfolio S&P 500 Growth ETF (SPYG)
- iShares Russell 1000 Growth ETF (IWF)
QGRW | QQQ | SCHG | VUG | SPYG | IWF | |
Inception | 12/13/2022 | 3/10/1999 | 12/11/2009 | 1/26/2004 | 9/25/2000 | 5/22/2000 |
Expense Ratio | 0.28% | 0.20% | 0.04% | 0.04% | 0.04% | 0.19% |
AUM | $455.98M | $272.57B | $30.74B | $254.81B | $27.68B | $92.73B |
Avg Daily Volume | $3.09M | $16.94B | $142.64M | $376.39M | $201.74M | $471.29M |
Holdings | 100 | 102 | 251 | 191 | 232 | 398 |
Top 10 | 59.45% | 49.42% | 58.12% | 59.46% | 57.69% | 58.59% |
QGRW is the newest, smallest, least liquid fund of this list, and it has the highest expense ratio. The next chart plots total returns since its inception. QGRW is the best performer, ahead of SCHG and QQQ.
QGRW vs competitors, since inception (Seeking Alpha)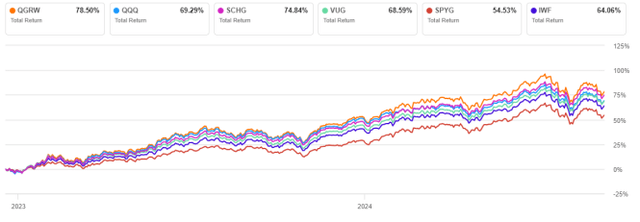
Takeaway
WisdomTree U.S. Quality Growth Fund ETF holds 100 large and mid-caps with strong characteristics of growth and quality. QGRW is very concentrated in technology and in its top holdings. As expected from the strategy description, growth and quality metrics are significantly above the benchmark, whereas valuation ratios are quite pricey. QGRW has beaten the most popular growth ETFs since December 2022 in a strong bull market. Its quality filters might help QGRW beat them also in a bearish environment, but this is still to be proven. However, keep in mind that all growth funds are likely to be more volatile and decline faster than the benchmark in a bear market. In conclusion, QGRW's track record is encouraging compared to its competitors, but it is still way too short to judge the strategy.
Disclaimer: Investing carries risk. This is not financial advice. The above content should not be regarded as an offer, recommendation, or solicitation on acquiring or disposing of any financial products, any associated discussions, comments, or posts by author or other users should not be considered as such either. It is solely for general information purpose only, which does not consider your own investment objectives, financial situations or needs. TTM assumes no responsibility or warranty for the accuracy and completeness of the information, investors should do their own research and may seek professional advice before investing.
Most Discussed
- 1
- 2
- 3
- 4
- 5
- 6
- 7
- 8
- 9
- 10