VOT: Growth ETF With Quality, But Lagging Some Peers
Torsten Asmus
This article series aims at evaluating ETFs (exchange-traded funds) regarding past performance and portfolio metrics. Reviews with updated data are posted when necessary.
VOT strategy
Vanguard Mid-Cap Growth Index Fund ETF Shares (NYSEARCA:VOT) was launched on 08/17/2006 and "is designed to accurately represent the mid-cap growth segment of the U.S. equity market and deliver low turnover". It has 140 holdings, a 30-day SEC yield of 0.69% and an expense ratio of 0.07%. The underlying index, CRSP US Mid-Cap Growth Index, is also available as a mutual fund, Vanguard Mid-Cap Growth Index Fund Inst (VMGMX).
According to index designer CRSP (Center for Research in Security Prices, an affiliate of the University of Chicago), "CRSP Market Indexes are based on a proprietary methodology using publicly-available market data". CRSP growth indexes represent "70% to 85% of the cumulative capitalization of CRSP US Total Market". Little information is provided about the methodology. The fund's turnover rate in the most recent fiscal year was 14%, which is quite low for a growth ETF. This article will use as a benchmark the parent index CRSP US Mid-Cap Index, represented by Vanguard Mid-Cap Index Fund ETF Shares (VO).
VOT portfolio
The two heaviest sectors in the portfolio, technology and industrials, are almost on par (22.6% and 22.1% of asset value, respectively). They are followed by consumer discretionary (13.4%) and healthcare (12%). Other sectors are below 8%. Compared to the parent index, VOT mostly overweights technology and telecommunications. It significantly underweights financials, utilities, consumer staples and basic materials.
VOT sector breakdown (Chart: author; data: Vanguard)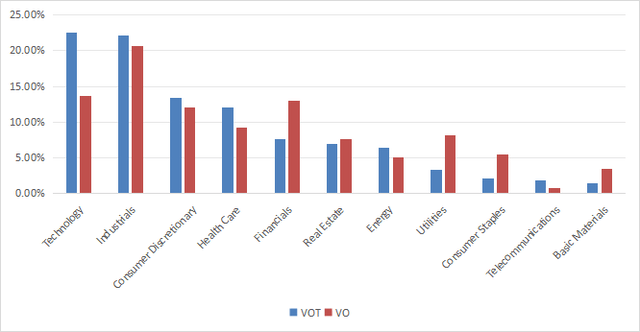
The top 10 holdings are listed below with growth metrics. They represent 17.2% of asset value and the top name weighs 2.2%, so the fund is well-diversified and risks related to individual companies are low.
Ticker | Name | Weight% | EPSgrowth %TTM | EPSgrowth %5Y | SalesGrowth %TTM | SalesGrowth %5Y |
APH | Amphenol Corporation | 2.19% | 9.19 | 10.05 | 6.61 | 8.89 |
TDG | TransDigm Group Incorporated | 1.95% | 44.03 | 6.17 | 21.72 | 11.56 |
MSI | Motorola Solutions, Inc. | 1.89% | -3.12 | 12.07 | 7.96 | 6.32 |
WELL | Welltower Inc. | 1.89% | 154.01 | -10.51 | 14.18 | 7.13 |
CTAS | Cintas Corporation | 1.87% | 16.67 | 13.69 | 8.86 | 6.84 |
CEG | Constellation Energy Corporation | 1.70% | 214.71 | 34.63 | -9.69 | 0.68 |
PLTR | 1.54% | 758.91 | 17.75 | 21.22 | 30.17 | |
APO | Apollo Global Management, Inc. | 1.42% | 336.12 | 96.49 | 8.89 | 95.45 |
O | Realty Income Corporation | 1.42% | -19.59 | -0.02 | 28.70 | 25.27 |
MCHP | Microchip Technology Incorporated | 1.35% | -42.09 | 37.42 | -24.84 | 7.37 |
Fundamentals
Fundamental metrics, reported in the next table, are in line with expectations for a growth fund. VOT is significantly more expensive than its parent index regarding valuation ratios, and has better aggregate growth rates.
VOT | VO | |
P/E TTM | 30.02 | 22.25 |
Price/Book | 5.27 | 3.05 |
Price/Sales | 4.39 | 1.92 |
Price/Cash Flow | 20.45 | 14.51 |
Earnings growth | 21.70% | 16.50% |
Sales growth % | 13.32% | 7.76% |
Cash flow growth % | 17.41% | 12.64% |
Data source: Fidelity
Fundamentally risky stocks weigh 17.5% of asset value, based on my proprietary criteria (including ROA, payout ratio, Piotroski and Altman scores). This bad number is offset by aggregate quality metrics, which are superior to a mid-cap benchmark (my calculation is reported in the next table).
VOT | Mid-cap benchmark | |
Altman Z-score | 7.69 | 3.35 |
Piotroski F-score | 5.77 | 5.73 |
ROA % TTM | 8.4 | 5.34 |
Performance
Using a starting point on 9/1/2006, VOT has outperformed its parent index. Nonetheless, the gap of 15 bps in annualized return is insignificant. Volatility is marginally higher, resulting in the same risk-adjusted performance (Sharpe ratio in the next table).
Total Return | Annual.Return | Drawdown | Sharpe ratio | Volatility | |
VOT | 406.03% | 9.41% | -60.17% | 0.51 | 18.79% |
VO | 393.78% | 9.26% | -58.88% | 0.51 | 18.03% |
However, the growth fund has underperformed by about 11% over the last 3 years:
VOT vs VO, 3-year total return (Seeking Alpha)
VOT vs. competitors
The next table compares the characteristics of VOT and five of the largest mid-cap growth ETFs:
- iShares Morningstar Mid-Cap Growth ETF (IMCG).
- iShares S&P Mid-Cap 400 Growth ETF (IJK).
- Nuveen ESG Mid-Cap Growth ETF (NUMG).
- First Trust Mid Cap Growth AlphaDEX® Fund ETF (FNY).
- Janus Henderson Small/Mid Cap Growth Alpha ETF (JSMD).
VOT | IMCG | IJK | NUMG | FNY | JSMD | |
Inception | 08/17/2006 | 06/28/2004 | 07/24/2000 | 12/13/2016 | 04/19/2011 | 02/23/2016 |
Expense Ratio | 0.07% | 0.06% | 0.17% | 0.31% | 0.70% | 0.30% |
AUM | $25.75B | $2.06B | $9.47B | $384.14M | $345.62M | $364.45M |
Avg Daily Volume | $43.65M | $7.20M | $27.22M | $930.26K | $1.20M | $1.06M |
Holdings | 140 | 306 | 258 | 45 | 227 | 254 |
Top 10 | 17.22% | 10.00% | 11.72% | 32.11% | 8.55% | 25.16% |
Turnover | 14.00% | 43.00% | 50.00% | 100.00% | 142.00% | 91.00% |
VOT is the largest and most liquid of these funds. It has the lowest turnover and the second-cheapest fee (almost tied with IMCG). The next chart compares total returns, starting on 12/14/2016 to match all inception dates. VOT is in the middle of the pack, significantly lagging the best performer IMCG.
VOT vs competitors, since 12/14/2016 (Seeking Alpha)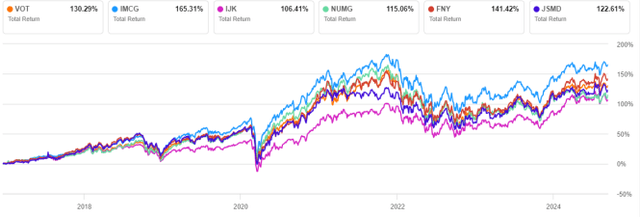
VOT is second to last over the last 3 years:
VOT vs competitors, 3-year return (Seeking Alpha)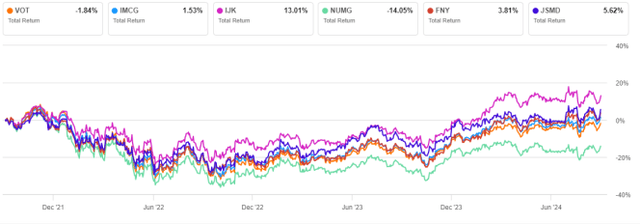
Takeaway
Vanguard Mid-Cap Growth Index Fund ETF Shares (VOT) is well diversified across 140 mid-cap stocks with growth characteristics and a focus on technology and industrials. Not only growth rates, but also quality metrics are superior to the parent index. However, VOT is only shortly ahead of it in total return since inception and its recent performance is average compared to other mid-cap growth funds. iShares Morningstar Mid-Cap Growth ETF (IMCG) has a more attractive track record and a marginally lower fee.
Disclaimer: Investing carries risk. This is not financial advice. The above content should not be regarded as an offer, recommendation, or solicitation on acquiring or disposing of any financial products, any associated discussions, comments, or posts by author or other users should not be considered as such either. It is solely for general information purpose only, which does not consider your own investment objectives, financial situations or needs. TTM assumes no responsibility or warranty for the accuracy and completeness of the information, investors should do their own research and may seek professional advice before investing.
Most Discussed
- 1
- 2
- 3
- 4
- 5
- 6
- 7
- 8
- 9
- 10