Crypto: Aptos On Its Way To Its ATH? Technical Analysis From October 17, 2024
Aptos shows a bullish acceleration since its last dip, rebounding by more than 146% in two months. Let’s examine the future prospects for the APT price.
Situation of Aptos (APT)
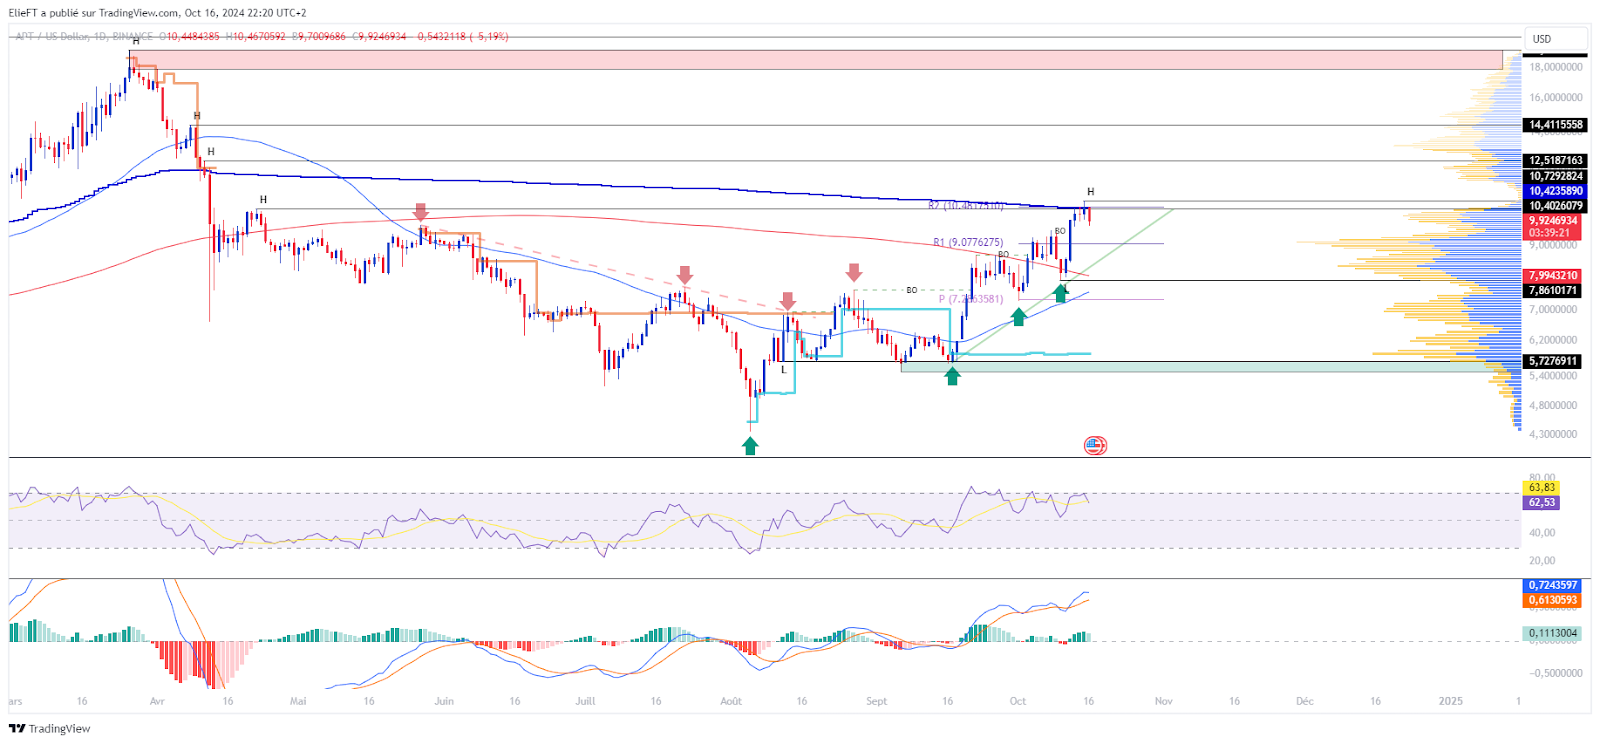
After diving towards $4.36, Aptos rebounded to reach a new peak around $7. The cryptocurrency then established a support zone around $5.5, which has been tested several times. Furthermore, it should be noted that this level was accompanied by a significant value area, thus demonstrating its importance. APT then relied on this support to break through its resistance and gradually reach new highs.
At the time of writing, the Aptos price is trading around $9.8. Its recent movements have thus enabled a bullish reversal of the short and medium-term trend. This observation is reinforced by the fact that the crypto price has exceeded its 50 and 200-day moving averages, which seem poised to form a “golden cross”. Nevertheless, although everything seems favorable, it should be noted that the cryptocurrency has recently reached a resistance located at the same level as the annual VWAP, around $10.40. Thus, this price level caused a slight drop in its price. Regarding Aptos’s dynamics, although it has slightly pulled back, it overall appears to be rising, as evidenced by its price and oscillators.
The current technical analysis was carried out in collaboration with Elie FT, an passionate investor and trader in the cryptocurrency market. Today, a trainer at Family Trading, a community of thousands of independent traders active since 2017. You will find Lives, educational content, and mutual support around financial markets in a professional and warm atmosphere.
Focus on Aptos Derivatives (APT/USDT)
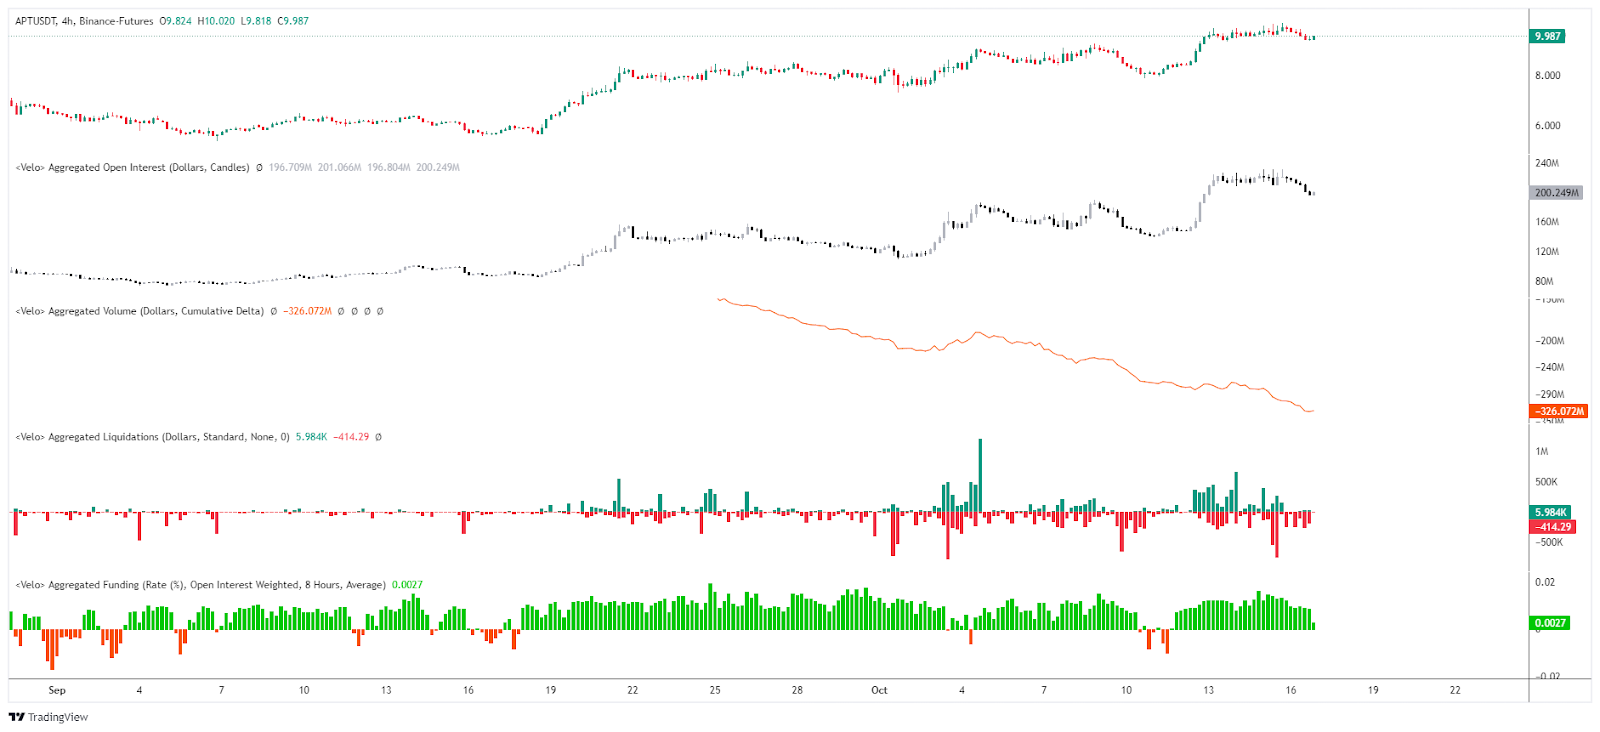
The open interest of APT/USDT perpetual contracts has evolved in the same manner as its underlying, demonstrating increasing interest from speculators, mainly in purchasing. However, the CVD completely diverges, being revised downwards. This indicates there is currently significant selling pressure on Aptos derivatives. This can be explained both by profit-taking and by the accumulation of ongoing short positions.
On the financing rates side, these appear slightly positive, illustrating a balance between buyers and sellers on the perpetual contracts of the crypto. Concerning liquidations, it seems that the last drop of APT has caused liquidations of buying positions. This suggests a possible capitulation in progress by buyers.
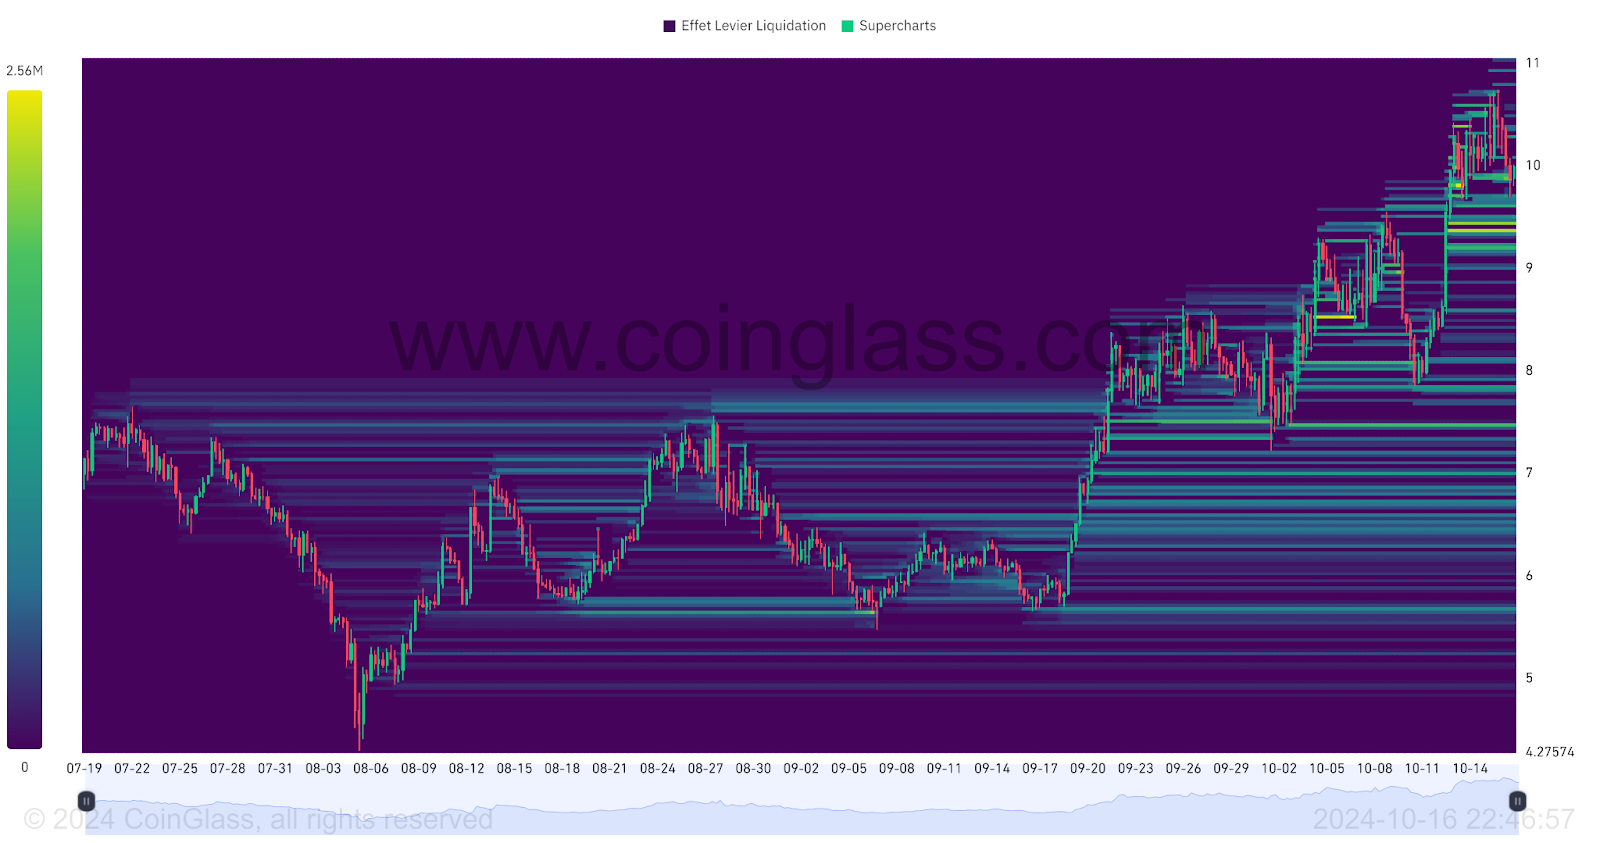
The heat map of APT/USDT contracts liquidations indicates that the Aptos price is currently in a liquidation zone. This has generated buying interest, leading to a slight increase in price. While this seems encouraging, it is important to note that an even more significant liquidation zone is just below, between $9.5 and $9. Lower, we also observe the $7.8 and $7.5 zones. If the price approaches these levels, it could trigger a large number of orders, increasing the risk of high volatility for the crypto. These zones thus represent key points to monitor for investors.
Forecast for Aptos (APT) Price
- If the Aptos price remains above $8, or even $7, we could anticipate a bullish continuation to the level of $12. The next resistance to monitor, if the bullish movement continues, would be around $14. Beyond that, we can note the level of $18, which would represent an increase of over 82%.
- If the Aptos price fails to stay above $8, or even $7, a return to $6 could be envisaged. The next support to monitor, if the bearish movement continues, would be at $6. Even lower, we can note the $5.5 support, representing a drop of about 44%.
Conclusion
Aptos has experienced a significant rebound, reaching new highs. Now, the trend seems to be bullish, with positive signs for the future. However, resistance has stalled its momentum, causing a slight correction in its price. Thus, it will be essential to closely monitor the price reaction to key levels to validate or revise the current forecasts. Finally, let us recall that this analysis is based solely on technical criteria, and that the price of cryptocurrencies can quickly change based on other more fundamental factors.
Disclaimer: Investing carries risk. This is not financial advice. The above content should not be regarded as an offer, recommendation, or solicitation on acquiring or disposing of any financial products, any associated discussions, comments, or posts by author or other users should not be considered as such either. It is solely for general information purpose only, which does not consider your own investment objectives, financial situations or needs. TTM assumes no responsibility or warranty for the accuracy and completeness of the information, investors should do their own research and may seek professional advice before investing.
Most Discussed
- 1
- 2
- 3
- 4
- 5
- 6
- 7
- 8
- 9
- 10