Daily Market Review: BTC, ETH, APE, JUP, HNT
The bears are in control of today’s session, as seen from the decrease in the global market cap. The total cap stood at $2.34T as of press time, representing a 0.28% decrease over the last 24 hours, while the trading volume dropped by 41% over the same period to stand at $41.5B as of press time.
Bitcoin Price Review
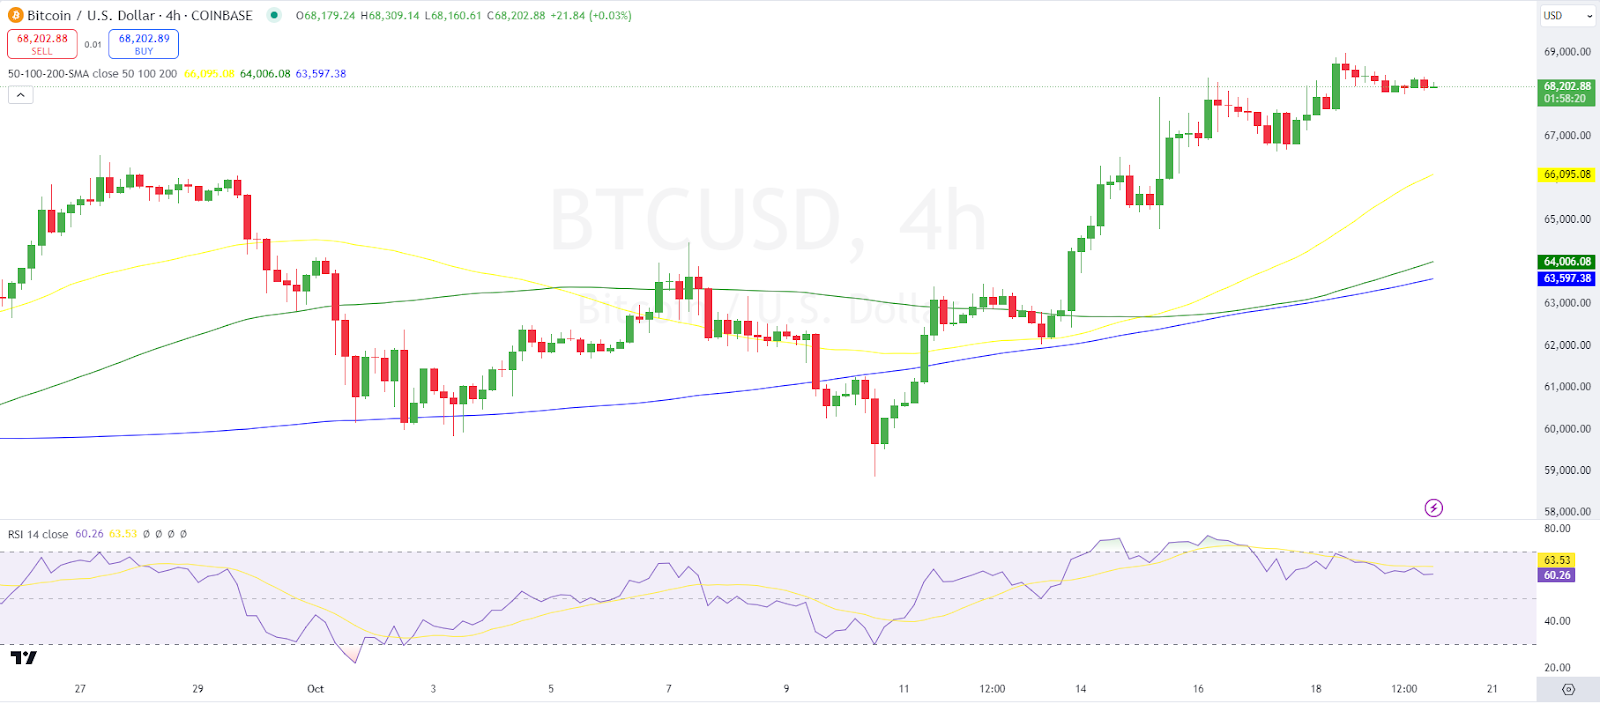
Bitcoin, $BTC, has failed to post gains in today’s session, as seen from its price movements. Looking at an in-depth analysis, we see that Bitcoin shows a solid uptrend as indicated by the price consistently staying above the moving averages (50, 100, 200-SMA). The 200-SMA (blue line) acts as strong support around $63,597.38, while the 100-SMA (green line) and the 50-SMA (yellow line) show a shorter-term upward movement.
On the other hand, we see that the Relative Strength Index (RSI) is neutral, hovering around the mid-range (60.26 to 63.53), indicating balanced buyer and seller momentum. Bitcoin traded at $68,203 as of press time, representing a 0.2% decrease over the last 24 hours.
Ethereum Price Review
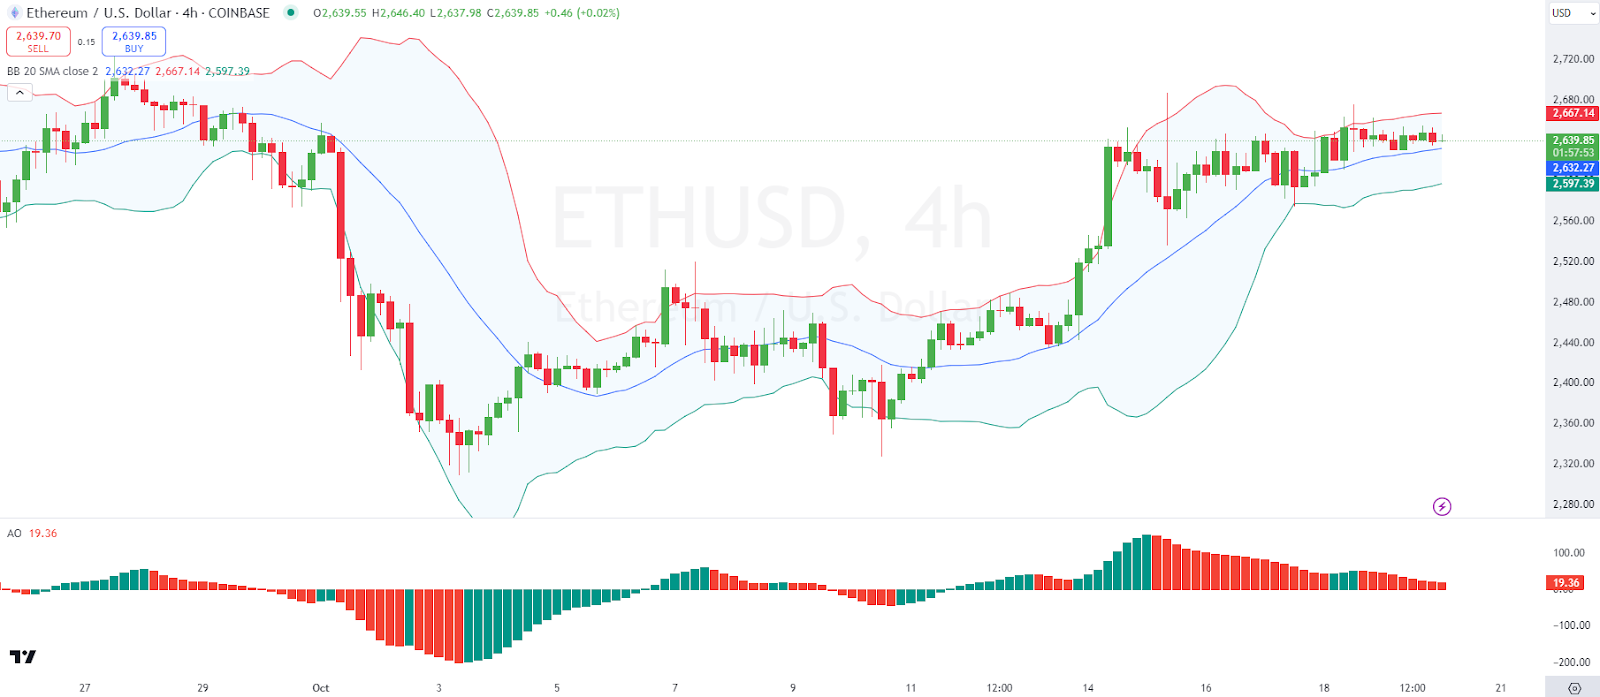
Ethereum, $ETH, has also failed to post gains in today’s session, as seen from its price movements. Looking at an in-depth analysis, we see that Ethereum displays a consolidation phase with the price moving within the Bollinger Bands without clear directional bias. The Ethereum price is capped by the upper Bollinger band around $2,667.14, suggesting immediate resistance, and supported by the middle band around $2,597.39.
On the other hand, we see that the Awesome Oscillator (AO) shows decreasing red bars, suggesting a potential loss in bearish momentum and possible bullish reversal if sustained. Ethereum traded at $2,642 as of press time, representing a 0.07% decrease over the last 24 hours.
ApeCoin Price Review
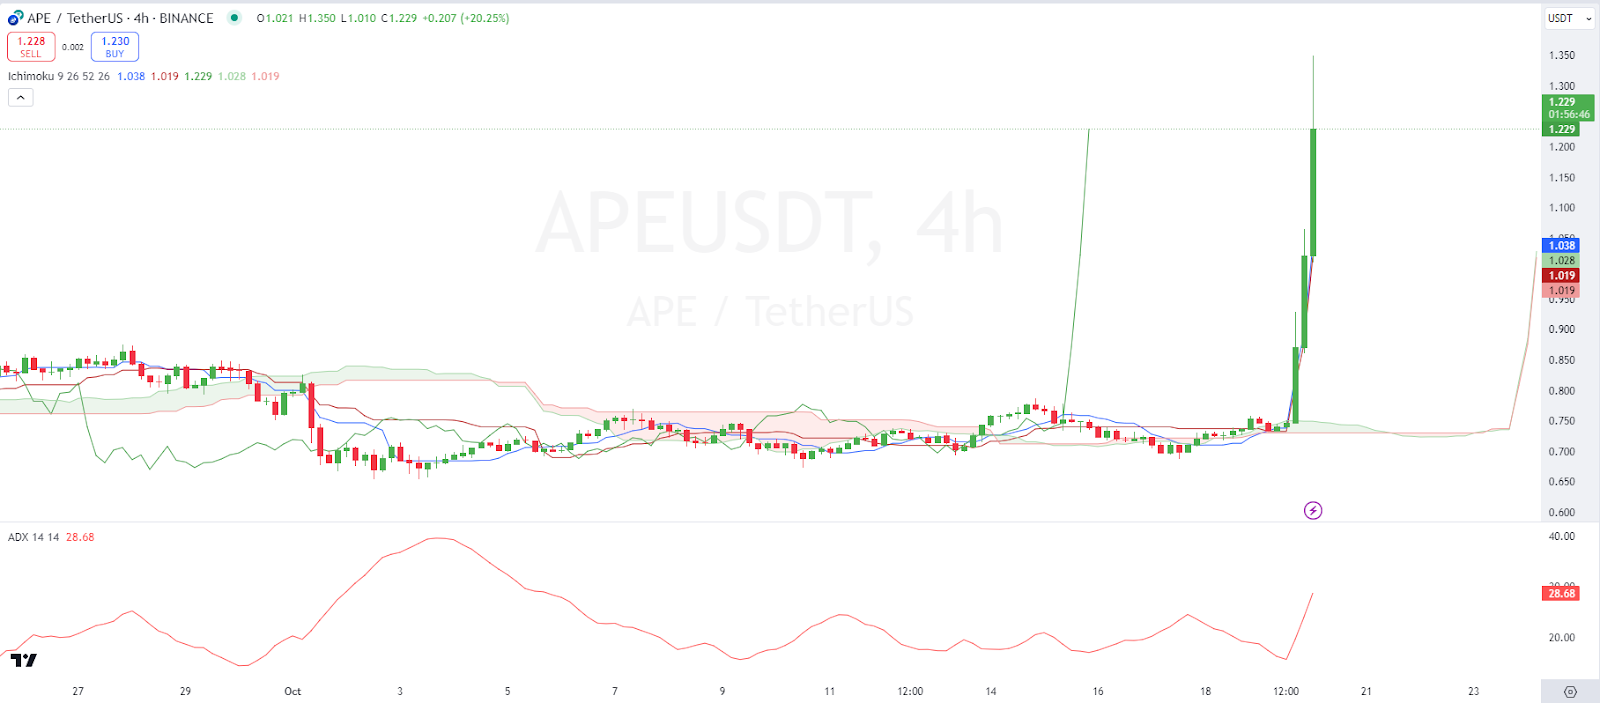
ApeCoin, $APE, is among the top gainers in today’s session as seen from its price movements. Looking at an in-depth analysis, we see a sudden vertical spike in price illustrates a sharp increase, breaking all prior resistance levels to peak at approximately $1.229. This surge suggests a high buying volume and momentum in a very short period.
On the other hand, we see that the Average Directional Index (ADX) peaks around 28.68, indicating a very strong trend associated with this sudden price movement. ApeCoin traded at $1.22 as of press time, representing a 62.8% increase over the last 24 hours.
Jupiter Price Review
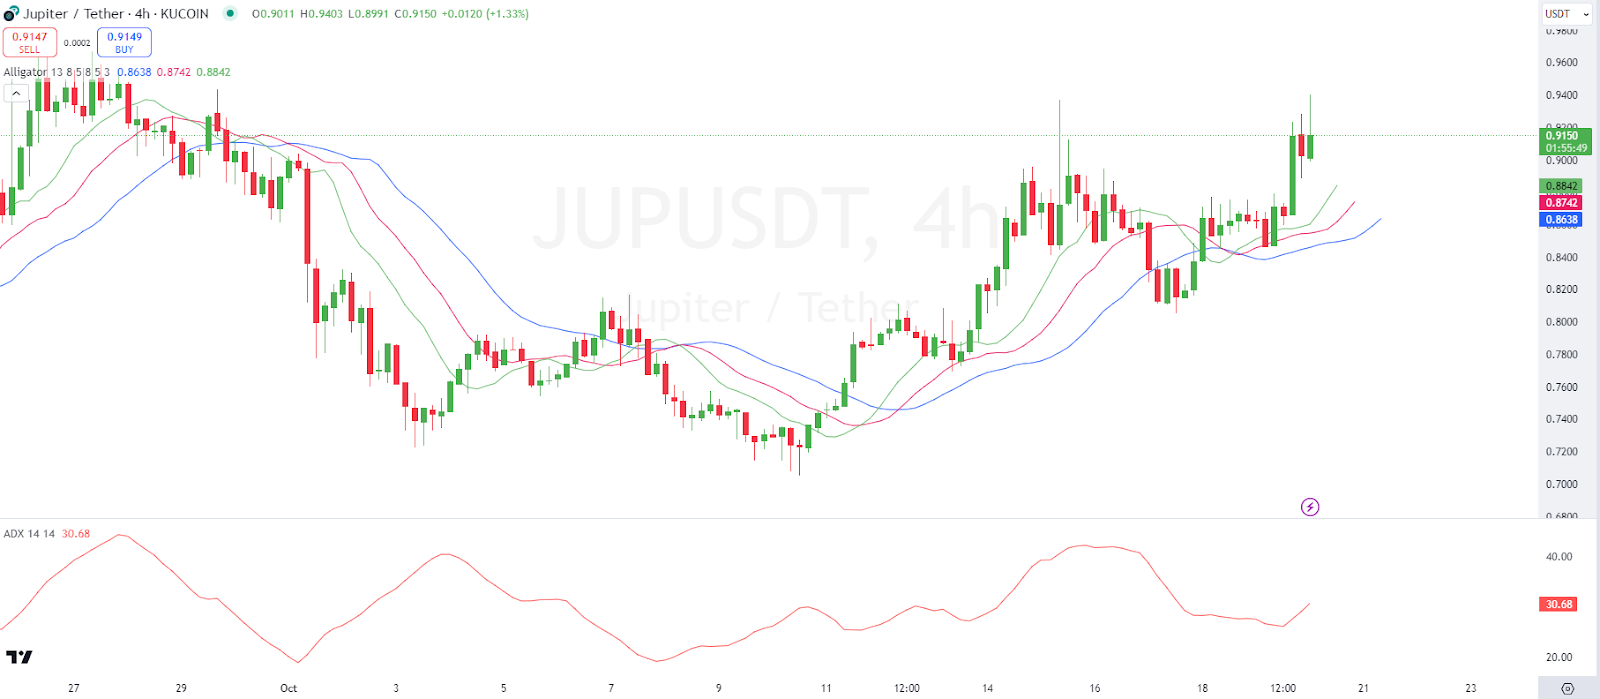
Jupiter, $JUP, is also among the top gainers in today’s session as seen from its price movements. Looking at an in-depth analysis, we see that the Jupiter price movement in this chart shows increasing bullish activity with higher highs and higher lows. Price crossing above multiple moving averages suggests a strong buying interest and bullish crossover.
Looking at other indicators, we see that the ADX on this chart indicates increasing trend strength, positioned at 30.68, pointing to a strong trend formation. Jupiter traded at $0.9161 as of press time, representing a 6.11% increase over the last 24 hours.
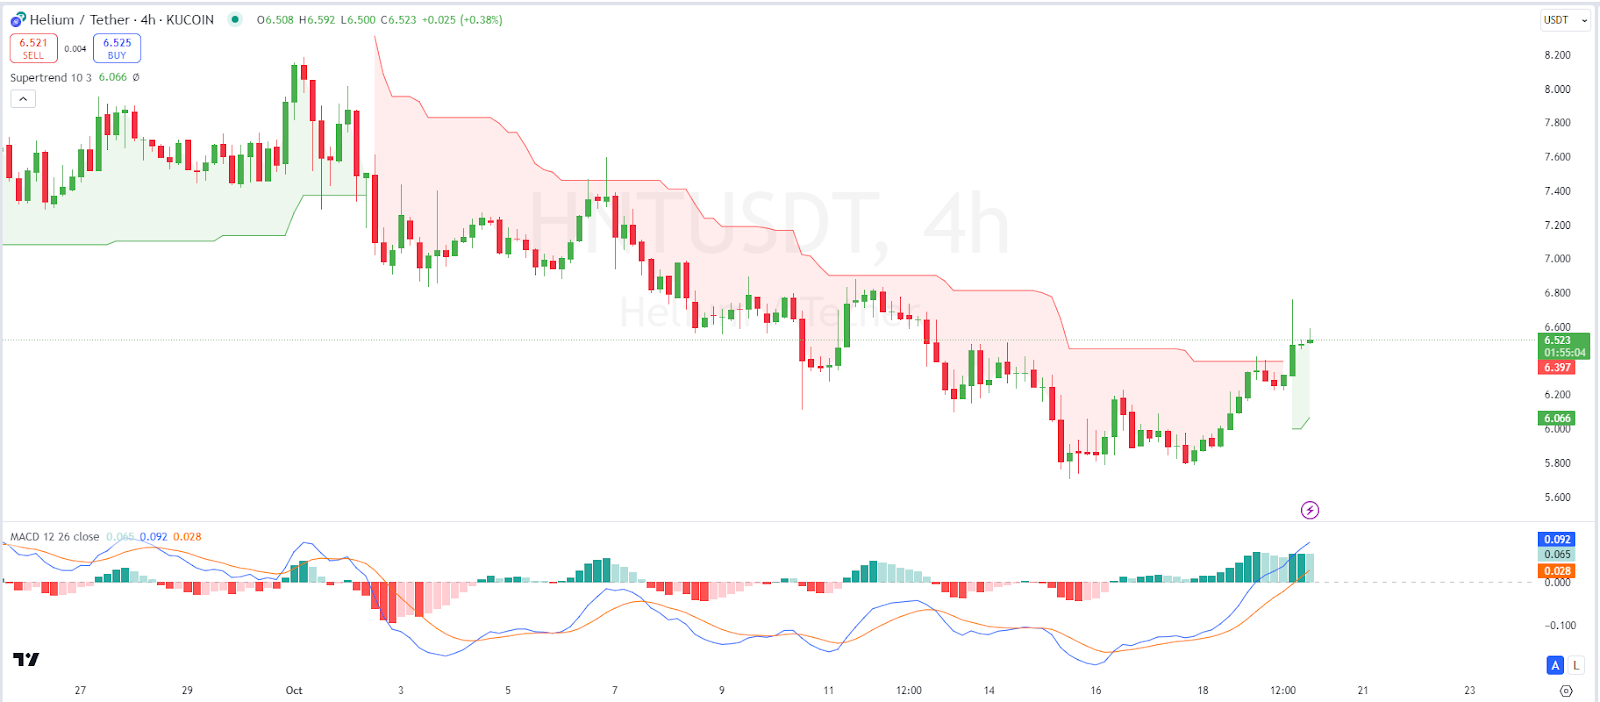
Helium Price Review
Helium, $HNT, is also among the top gainers in today’s session as seen from its price movements. Looking at an in-depth analysis, we see that the Jupiter Price has recently broken out above the upper boundary of the Supertrend indicator, turning it from red to green, signaling a bullish reversal. This breakout is accompanied by an increase in price from around $6.066 to current levels, suggesting a strong upward move.
On the other hand, we see that the MACD shows a bullish crossover, with the MACD line (blue) crossing above the signal line (orange), and the histogram turning green, indicating growing bullish momentum. Helium traded at $6.55 as of press time, representing a 2.7% increase over the last 24 hours.
Disclaimer: Investing carries risk. This is not financial advice. The above content should not be regarded as an offer, recommendation, or solicitation on acquiring or disposing of any financial products, any associated discussions, comments, or posts by author or other users should not be considered as such either. It is solely for general information purpose only, which does not consider your own investment objectives, financial situations or needs. TTM assumes no responsibility or warranty for the accuracy and completeness of the information, investors should do their own research and may seek professional advice before investing.
Most Discussed
- 1
- 2
- 3
- 4
- 5
- 6
- 7
- 8
- 9
- 10