Genpact Limited's (NYSE:G) Stock Is Going Strong: Is the Market Following Fundamentals?
Genpact (NYSE:G) has had a great run on the share market with its stock up by a significant 15% over the last three months. Since the market usually pay for a company’s long-term fundamentals, we decided to study the company’s key performance indicators to see if they could be influencing the market. In this article, we decided to focus on Genpact's ROE.
ROE or return on equity is a useful tool to assess how effectively a company can generate returns on the investment it received from its shareholders. In other words, it is a profitability ratio which measures the rate of return on the capital provided by the company's shareholders.
See our latest analysis for Genpact
How Do You Calculate Return On Equity?
The formula for return on equity is:
Return on Equity = Net Profit (from continuing operations) ÷ Shareholders' Equity
So, based on the above formula, the ROE for Genpact is:
28% = US$648m ÷ US$2.3b (Based on the trailing twelve months to June 2024).
The 'return' refers to a company's earnings over the last year. That means that for every $1 worth of shareholders' equity, the company generated $0.28 in profit.
What Is The Relationship Between ROE And Earnings Growth?
So far, we've learned that ROE is a measure of a company's profitability. We now need to evaluate how much profit the company reinvests or "retains" for future growth which then gives us an idea about the growth potential of the company. Assuming everything else remains unchanged, the higher the ROE and profit retention, the higher the growth rate of a company compared to companies that don't necessarily bear these characteristics.
Genpact's Earnings Growth And 28% ROE
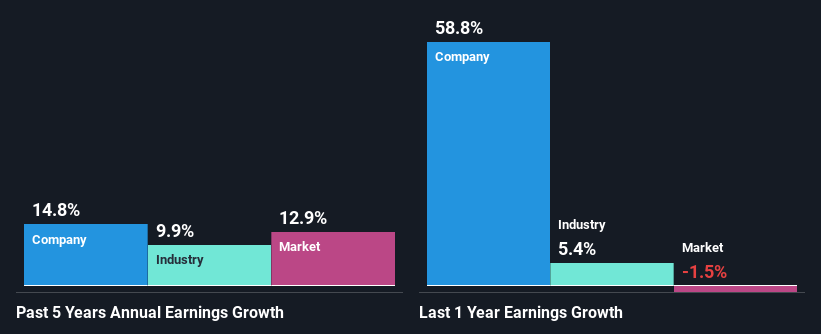
Firstly, we acknowledge that Genpact has a significantly high ROE. Second, a comparison with the average ROE reported by the industry of 16% also doesn't go unnoticed by us. This likely paved the way for the modest 15% net income growth seen by Genpact over the past five years.
As a next step, we compared Genpact's net income growth with the industry, and pleasingly, we found that the growth seen by the company is higher than the average industry growth of 9.9%.
Earnings growth is an important metric to consider when valuing a stock. It’s important for an investor to know whether the market has priced in the company's expected earnings growth (or decline). By doing so, they will have an idea if the stock is headed into clear blue waters or if swampy waters await. If you're wondering about Genpact's's valuation, check out this gauge of its price-to-earnings ratio, as compared to its industry.
Is Genpact Making Efficient Use Of Its Profits?
Genpact's three-year median payout ratio to shareholders is 22% (implying that it retains 78% of its income), which is on the lower side, so it seems like the management is reinvesting profits heavily to grow its business.
Moreover, Genpact is determined to keep sharing its profits with shareholders which we infer from its long history of eight years of paying a dividend. Upon studying the latest analysts' consensus data, we found that the company is expected to keep paying out approximately 19% of its profits over the next three years. Regardless, Genpact's ROE is speculated to decline to 21% despite there being no anticipated change in its payout ratio.
Conclusion
In total, we are pretty happy with Genpact's performance. In particular, it's great to see that the company is investing heavily into its business and along with a high rate of return, that has resulted in a sizeable growth in its earnings. With that said, on studying the latest analyst forecasts, we found that while the company has seen growth in its past earnings, analysts expect its future earnings to shrink. Are these analysts expectations based on the broad expectations for the industry, or on the company's fundamentals? Click here to be taken to our analyst's forecasts page for the company.
New: Manage All Your Stock Portfolios in One Place
We've created the ultimate portfolio companion for stock investors, and it's free.
• Connect an unlimited number of Portfolios and see your total in one currency• Be alerted to new Warning Signs or Risks via email or mobile• Track the Fair Value of your stocks
Try a Demo Portfolio for FreeHave feedback on this article? Concerned about the content? Get in touch with us directly. Alternatively, email editorial-team (at) simplywallst.com.This article by Simply Wall St is general in nature. We provide commentary based on historical data and analyst forecasts only using an unbiased methodology and our articles are not intended to be financial advice. It does not constitute a recommendation to buy or sell any stock, and does not take account of your objectives, or your financial situation. We aim to bring you long-term focused analysis driven by fundamental data. Note that our analysis may not factor in the latest price-sensitive company announcements or qualitative material. Simply Wall St has no position in any stocks mentioned.
Disclaimer: Investing carries risk. This is not financial advice. The above content should not be regarded as an offer, recommendation, or solicitation on acquiring or disposing of any financial products, any associated discussions, comments, or posts by author or other users should not be considered as such either. It is solely for general information purpose only, which does not consider your own investment objectives, financial situations or needs. TTM assumes no responsibility or warranty for the accuracy and completeness of the information, investors should do their own research and may seek professional advice before investing.
Most Discussed
- 1
- 2
- 3
- 4
- 5
- 6
- 7
- 8
- 9
- 10