Xencor (NASDAQ:XNCR) shareholders are up 7.9% this past week, but still in the red over the last three years
It is doubtless a positive to see that the Xencor, Inc. (NASDAQ:XNCR) share price has gained some 41% in the last three months. But that doesn't help the fact that the three year return is less impressive. Truth be told the share price declined 42% in three years and that return, Dear Reader, falls short of what you could have got from passive investing with an index fund.
While the last three years has been tough for Xencor shareholders, this past week has shown signs of promise. So let's look at the longer term fundamentals and see if they've been the driver of the negative returns.
Check out our latest analysis for Xencor
Because Xencor made a loss in the last twelve months, we think the market is probably more focussed on revenue and revenue growth, at least for now. When a company doesn't make profits, we'd generally hope to see good revenue growth. That's because it's hard to be confident a company will be sustainable if revenue growth is negligible, and it never makes a profit.
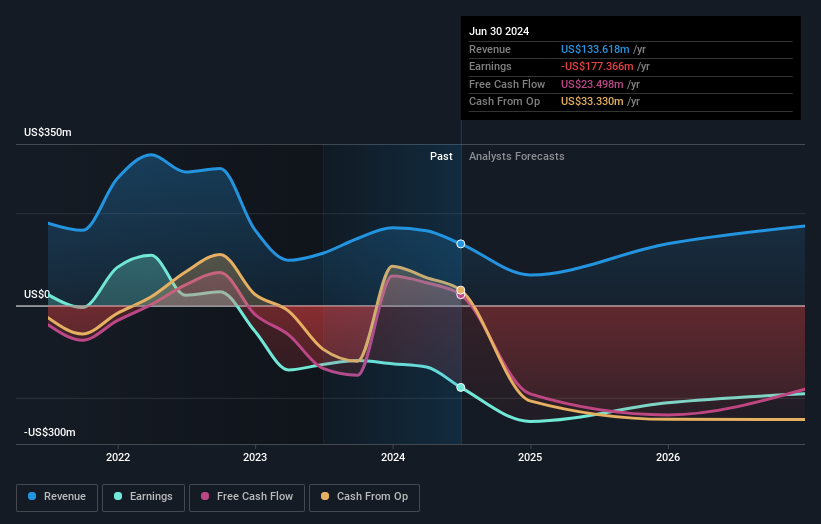
Over the last three years, Xencor's revenue dropped 20% per year. That's definitely a weaker result than most pre-profit companies report. On the face of it we'd posit the share price fall of 12% compound, over three years is well justified by the fundamental deterioration. It would probably be worth asking whether the company can fund itself to profitability. Of course, it is possible for businesses to bounce back from a revenue drop - but we'd want to see that before getting interested.
The image below shows how earnings and revenue have tracked over time (if you click on the image you can see greater detail).
Take a more thorough look at Xencor's financial health with this free report on its balance sheet.
A Different Perspective
Xencor shareholders gained a total return of 32% during the year. But that was short of the market average. On the bright side, that's still a gain, and it is certainly better than the yearly loss of about 6% endured over half a decade. So this might be a sign the business has turned its fortunes around. It's always interesting to track share price performance over the longer term. But to understand Xencor better, we need to consider many other factors. Even so, be aware that Xencor is showing 2 warning signs in our investment analysis , you should know about...
We will like Xencor better if we see some big insider buys. While we wait, check out this free list of undervalued stocks (mostly small caps) with considerable, recent, insider buying.
Please note, the market returns quoted in this article reflect the market weighted average returns of stocks that currently trade on American exchanges.
New: AI Stock Screener & Alerts
Our new AI Stock Screener scans the market every day to uncover opportunities.
• Dividend Powerhouses (3%+ Yield)• Undervalued Small Caps with Insider Buying• High growth Tech and AI CompaniesOr build your own from over 50 metrics.
Explore Now for FreeHave feedback on this article? Concerned about the content? Get in touch with us directly. Alternatively, email editorial-team (at) simplywallst.com.This article by Simply Wall St is general in nature. We provide commentary based on historical data and analyst forecasts only using an unbiased methodology and our articles are not intended to be financial advice. It does not constitute a recommendation to buy or sell any stock, and does not take account of your objectives, or your financial situation. We aim to bring you long-term focused analysis driven by fundamental data. Note that our analysis may not factor in the latest price-sensitive company announcements or qualitative material. Simply Wall St has no position in any stocks mentioned.
Disclaimer: Investing carries risk. This is not financial advice. The above content should not be regarded as an offer, recommendation, or solicitation on acquiring or disposing of any financial products, any associated discussions, comments, or posts by author or other users should not be considered as such either. It is solely for general information purpose only, which does not consider your own investment objectives, financial situations or needs. TTM assumes no responsibility or warranty for the accuracy and completeness of the information, investors should do their own research and may seek professional advice before investing.
Most Discussed
- 1
- 2
- 3
- 4
- 5
- 6
- 7
- 8
- 9
- 10