Solana (SOL) Bull Flag Hints at Extended Run Above $260 After Robinhood Relisting
For the first time since November 2021, Solana’s (SOL) price has retested the $220 level. This has fueled more speculation that the altcoin may be poised for new all-time highs.
Notably, the SOL charts across multiple timeframes lend support to this outlook. Here’s a closer look at the key indicators backing this prediction.
Solana Forms Bull Flag, Eye Massive Rally
On November 13, the altcoin’s price climbed back to $200. However, the major Solana breakout to $220 within the last 24 hours came as a result of Robinhood’s decision to relist the token.
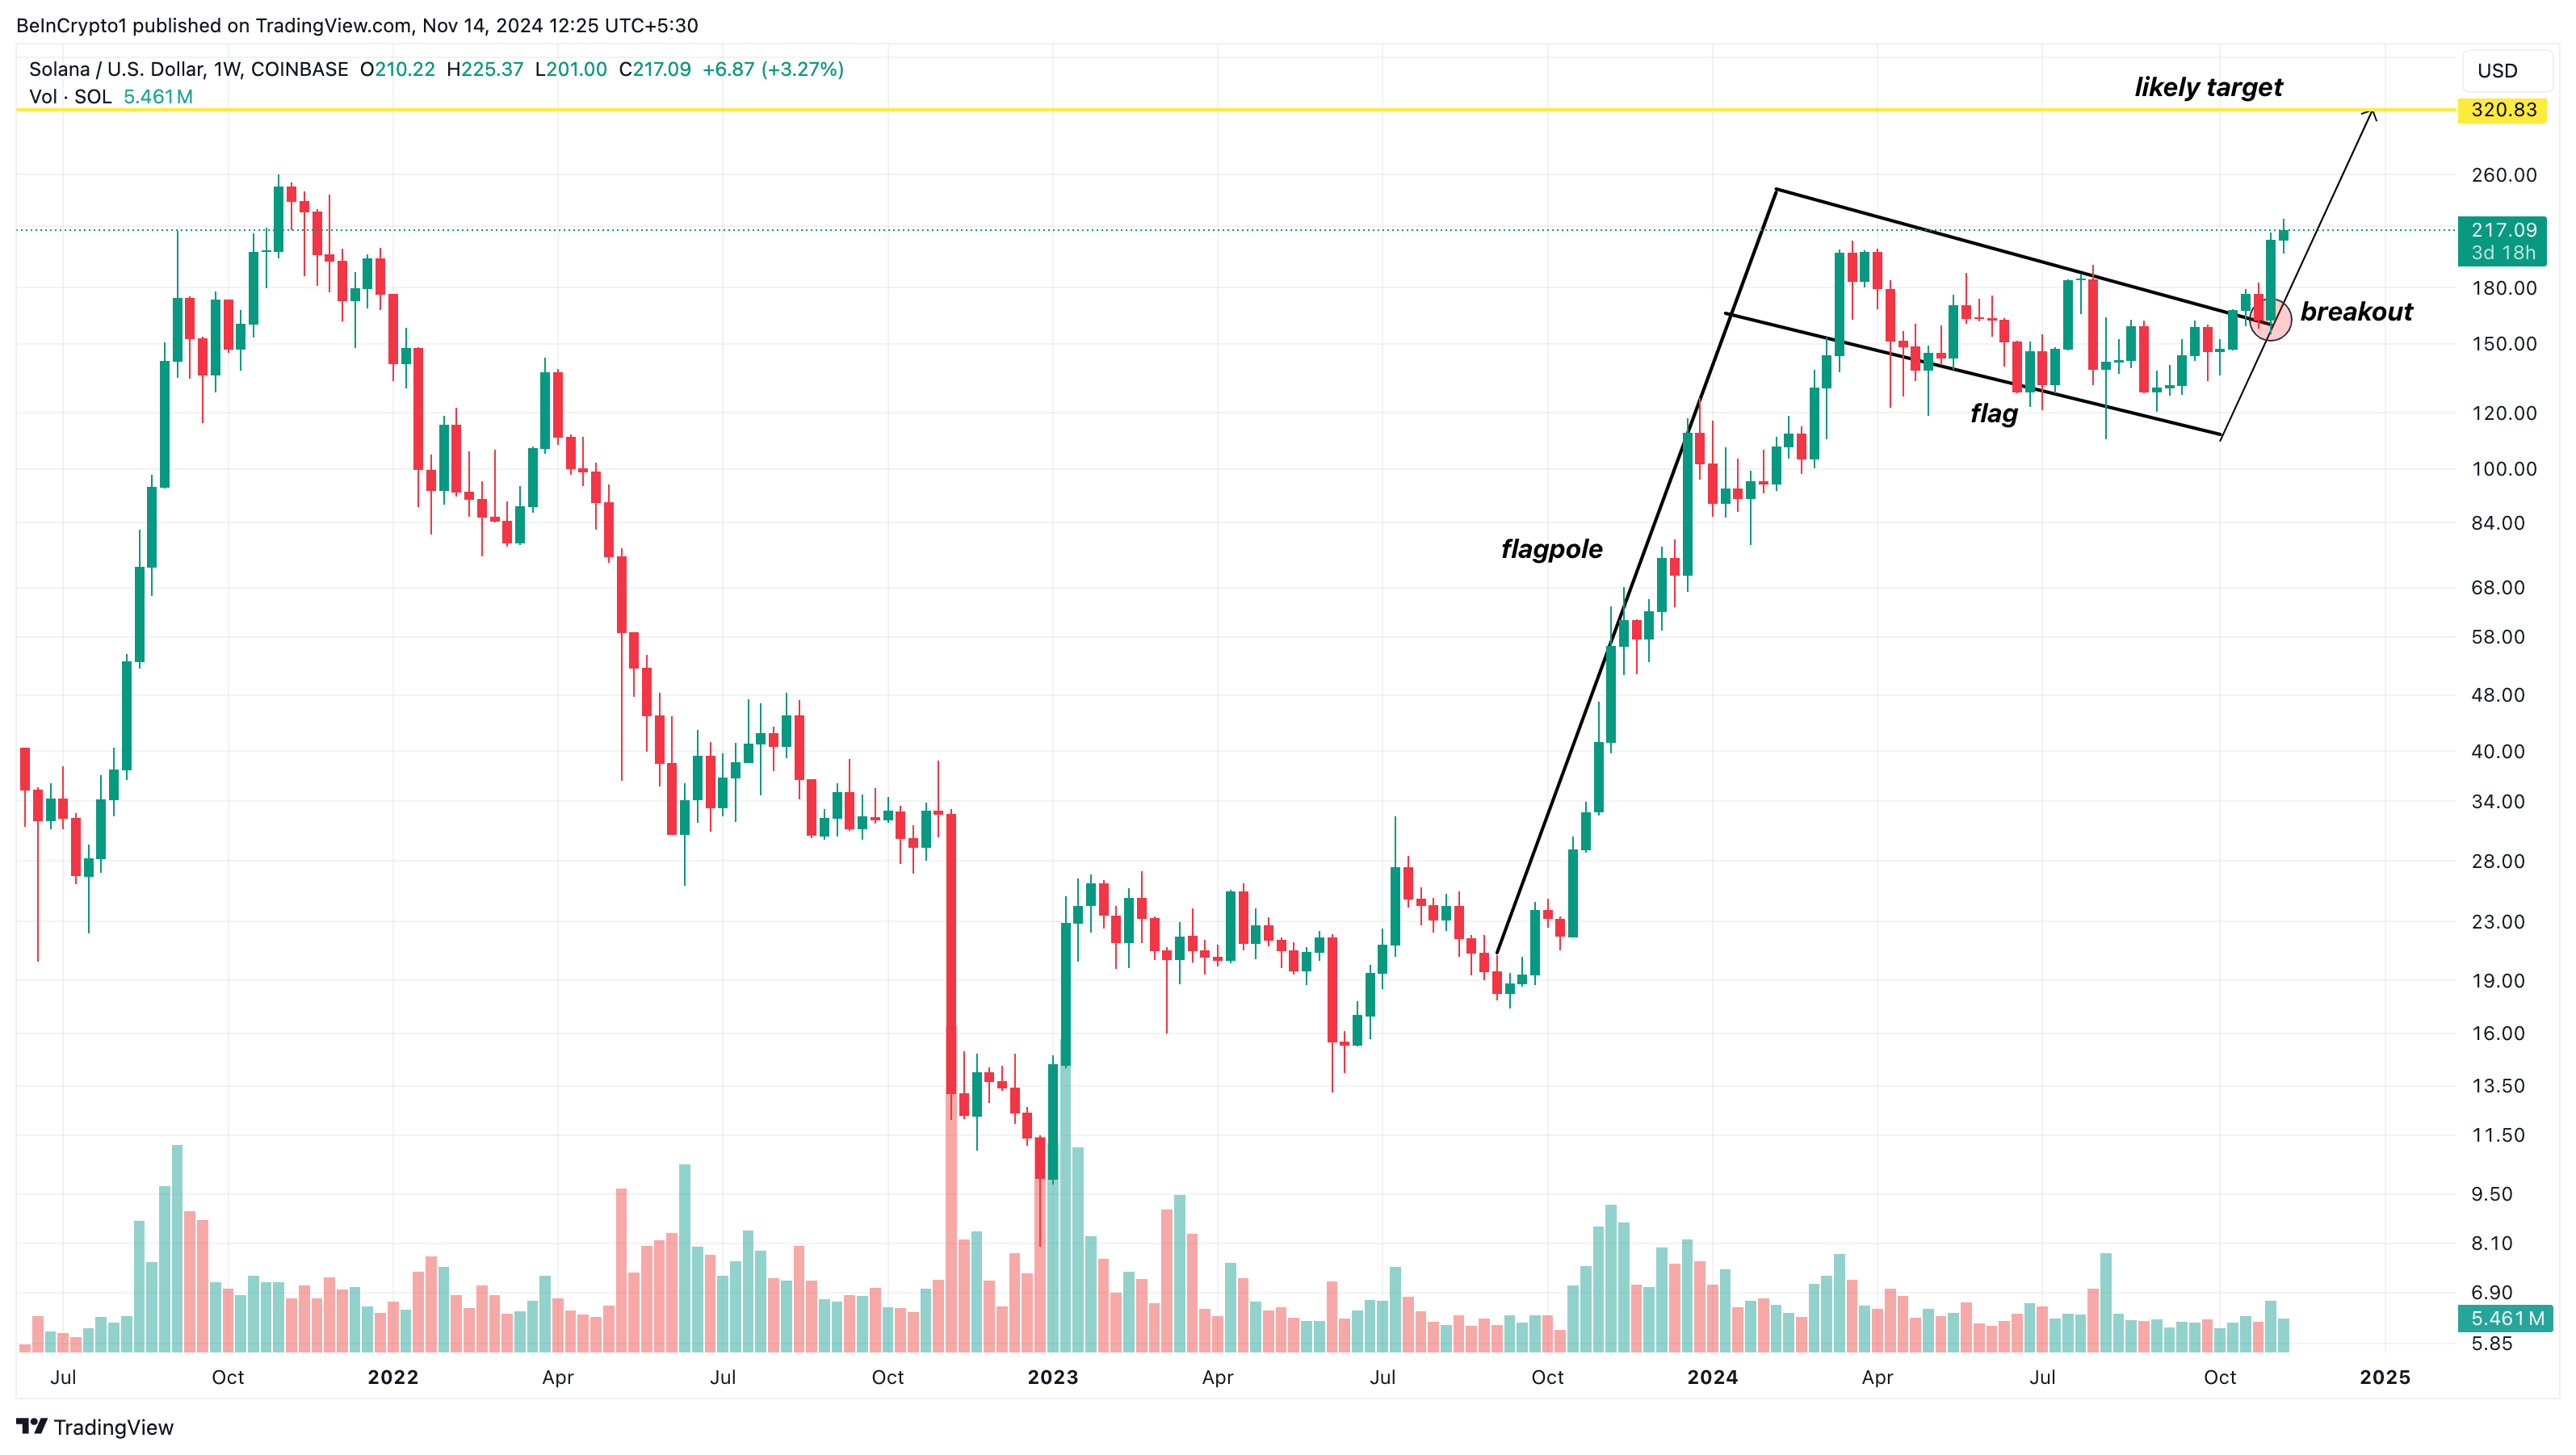
Following the latest development, Solana broke out of a bull flag on the weekly chart. A bull flag is a pattern characterized by two upward rallies, with a brief consolidation period in between. The pattern begins with a steep price spike (the “flagpole”) as buyers overpower sellers, followed by a pullback forming parallel upper and lower trendlines, which create the “flag.”
As seen below, SOL broke out of the bullish flag and briefly hit $220 before its recent decline to $217.52. If the technical pattern remains the same, then Solana’s price could rise above the $260 all-time high, with its mid-term target possibly hitting $320.83.
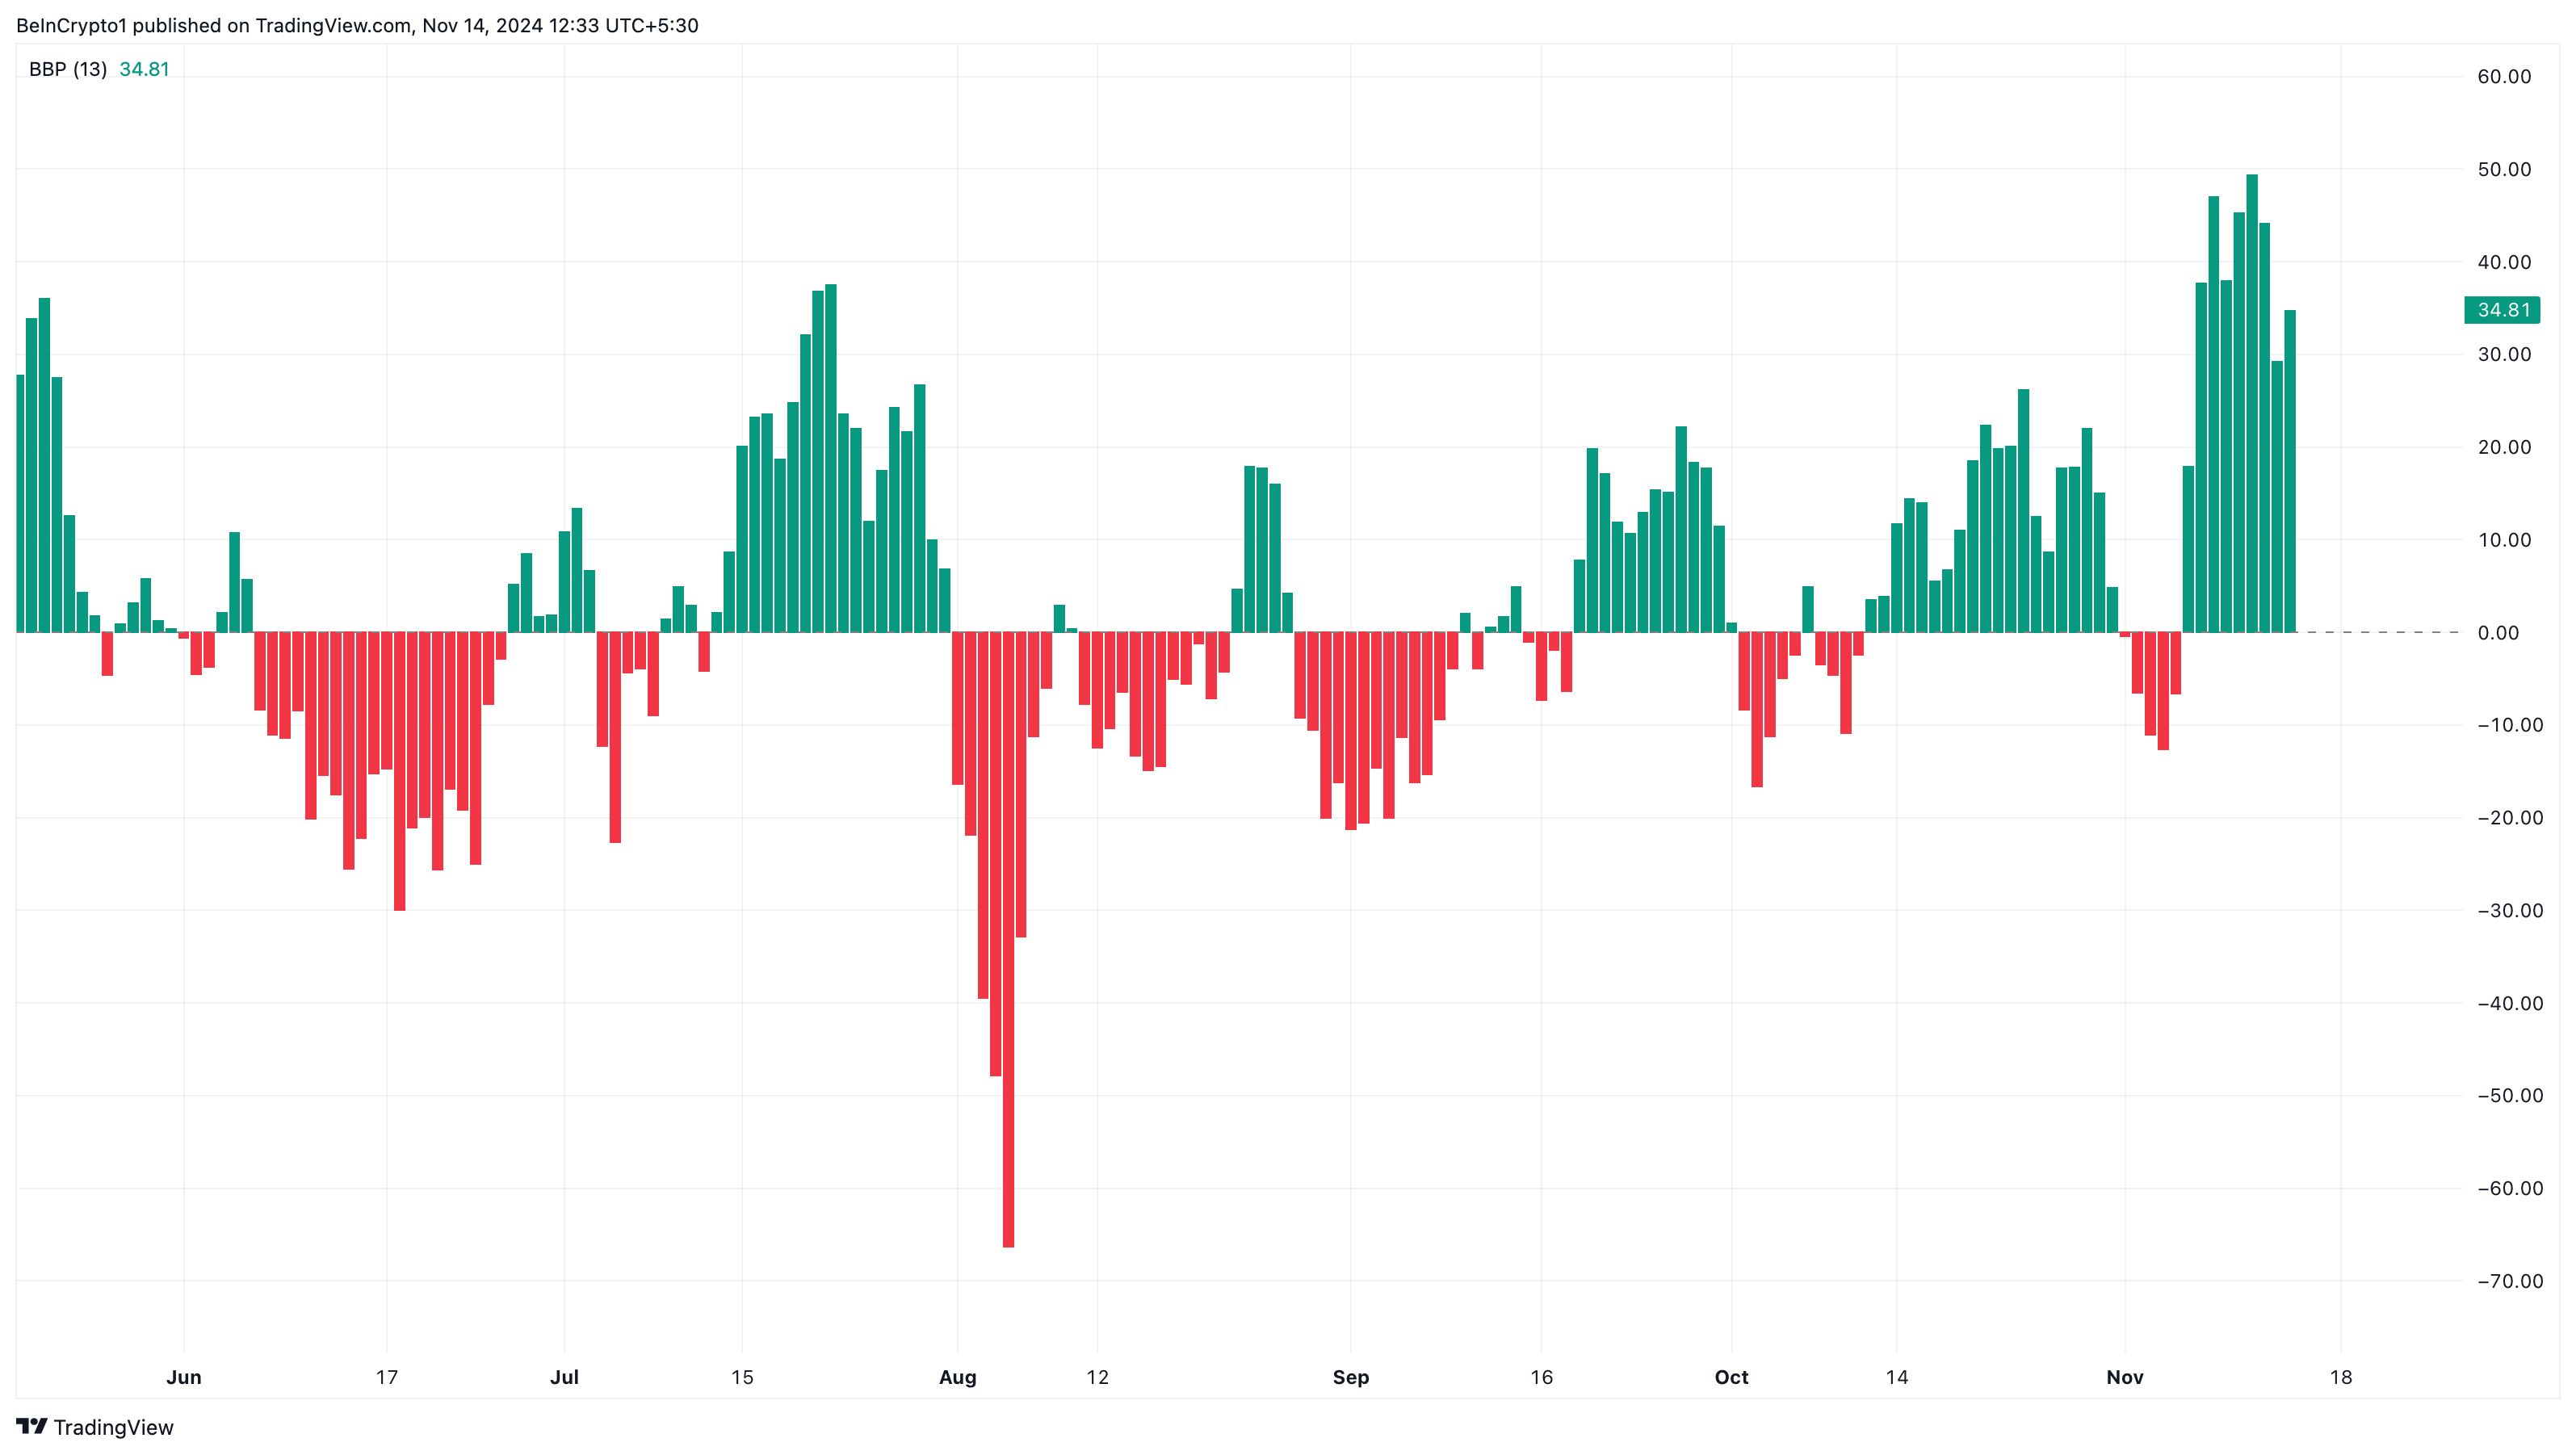
Further, an analysis of the daily chart supports this outlook, particularly due to the current state of the Bull Bear Power (BBP) indicator.
The BBP indicator assesses the strength of buyers (bulls) against sellers (bears) by measuring the difference between the highest price and a 13-period Exponential Moving Average (EMA). When the Bulls Power indicator is above zero, it indicates that buyers have kept the price above the EMA, indicating positive momentum.
But if it is the other way around, it signifies that sellers have tugged the price below the EMA, which is bearish. Therefore, the current state of the indicator, as shown below, suggests that bulls can keep pushing Solana’s price higher.
SOL Price Prediction: Double-Digit Hike Possible
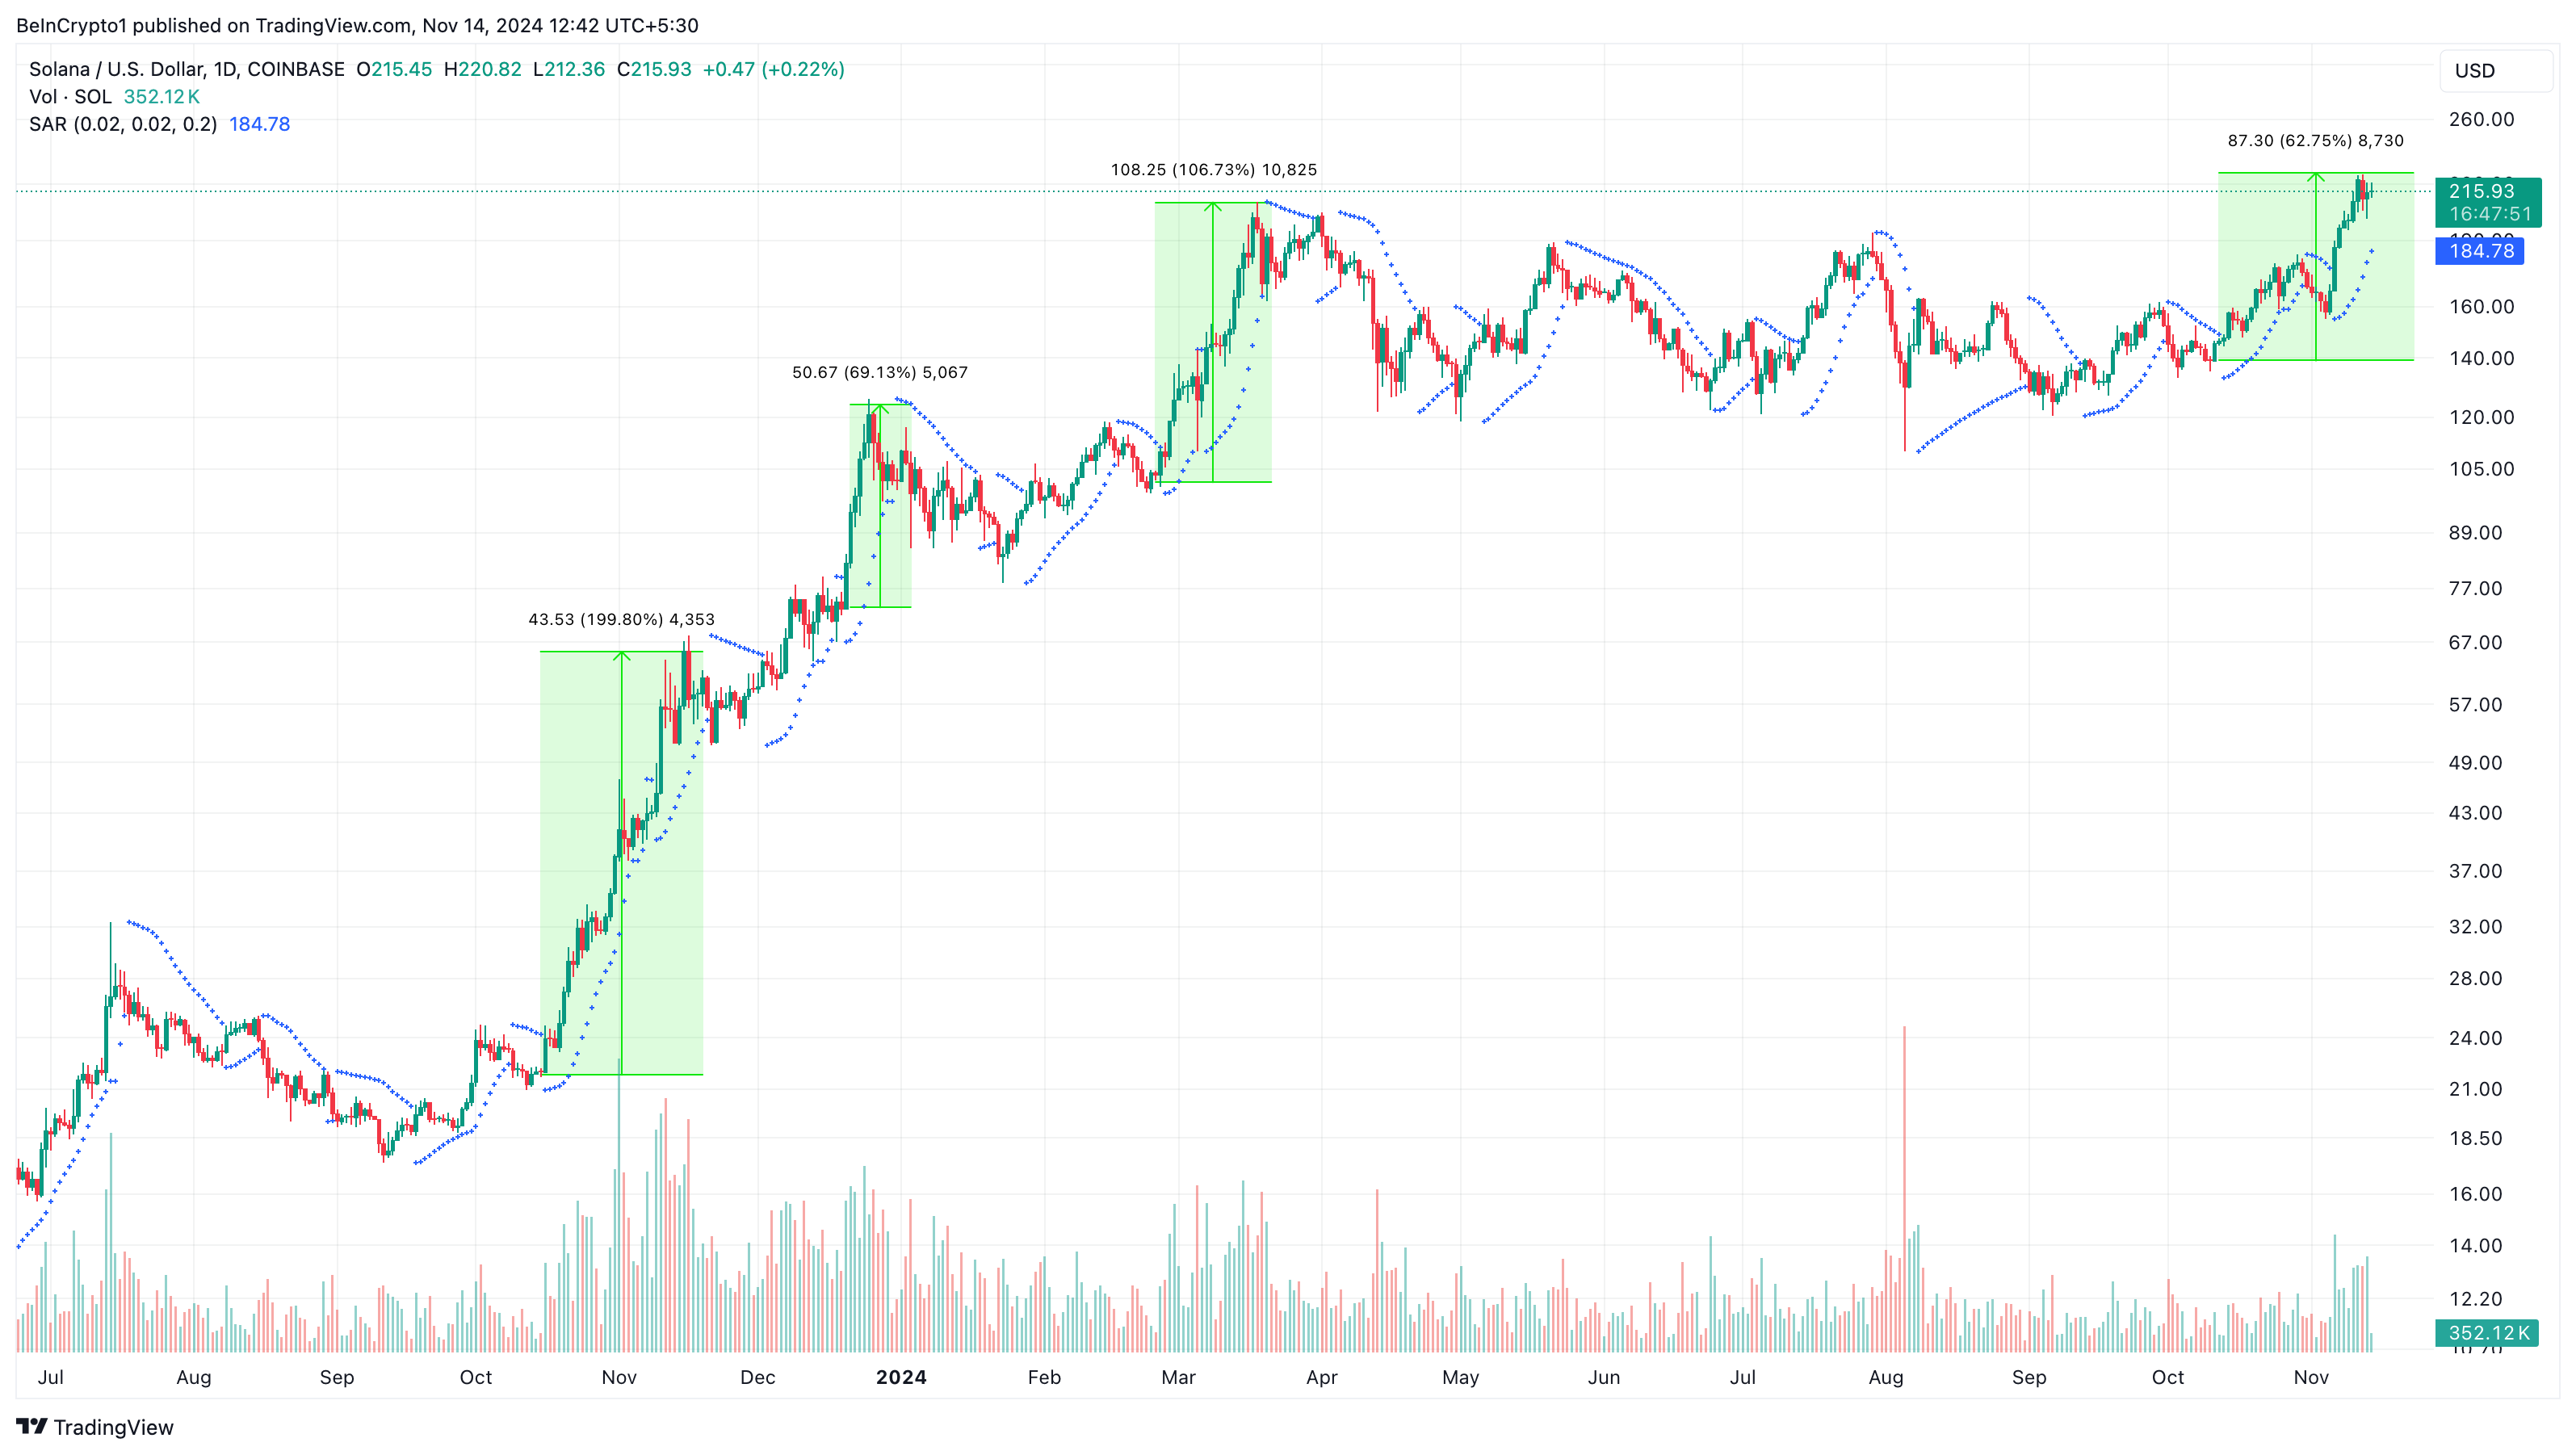
Meanwhile, another look at the daily chart shows that the Solana breakout is likely to continue. The parabolic Stop and Reverse (SAR) indicator suggests this.
The Parabolic SAR indicator helps traders identify the direction of a trend and potential price reversals. When the indicator places dots above or below the price, it suggests a downtrend. But in this case, it is below SOL’s price, suggesting a possible continuation of the uptrend.
Historically, when this happens, Solana’s price tends to go higher. For instance, as shown below, the altcoin almost always records a double-digit hike when this happens. Thus, if history repeats itself, then SOL could climb toward $260 within a few days.
If validated, this could accelerate the rally to $320.83, as mentioned above. On the other hand, if the dotted lines of the parabolic SAR rise above SOL’s price, then this prediction might be invalidated. In that scenario, the value might drop below $200.
Disclaimer: Investing carries risk. This is not financial advice. The above content should not be regarded as an offer, recommendation, or solicitation on acquiring or disposing of any financial products, any associated discussions, comments, or posts by author or other users should not be considered as such either. It is solely for general information purpose only, which does not consider your own investment objectives, financial situations or needs. TTM assumes no responsibility or warranty for the accuracy and completeness of the information, investors should do their own research and may seek professional advice before investing.
Most Discussed
- 1
- 2
- 3
- 4
- 5
- 6
- 7
- 8
- 9
- 10