XOP: Oil And Gas Relative Strength Picks Up, ETF Valuation Compelling
- Energy stocks have been bullish; XLE hit an all-time high, and Goldman Sachs is optimistic about oil prices short-term but cautious medium-term.
- XOP is rated a buy due to its low P/E ratio, improved technicals, and diversified portfolio, despite seasonal weaknesses.
- XOP's top 10 holdings are less than one-third of the fund, with a strong value focus and significant SMID cap allocation.
- Technical analysis shows bullish signals for XOP, with a potential target of $160, though resistance around $155 and seasonal risks remain.
SimonSkafar
Energy stocks have been on a stealthy bullish run over the past several months. I noticed that the Energy Select Sector SPDR ETF (XLE) notched a new all-time closing high earlier this week (on a total return basis) as both WTI and Brent crude oil remain stuck in neutral.
I also came across a research note from Goldman Sachs that was generally upbeat about price trends in the oil space. Goldman is less enthusiastic about medium-term prospects, though, keeping to a Brent forecast of $70 to $85 through 2027.
With a price-to-earnings ratio barely above 10x and some encouraging trends on the chart, I reiterate a buy rating on the SPDR S&P Oil & Gas Exploration & Production ETF (NYSEARCA:XOP). Readers also might have heard that XOP’s biggest position, Texas Pacific Land Corporation (TPL) will be added to the S&P 500, replacing Marathon Oil (MRO).
Energy Stocks Leading Along with Financials in Q4 Thus Far
Koyfin Charts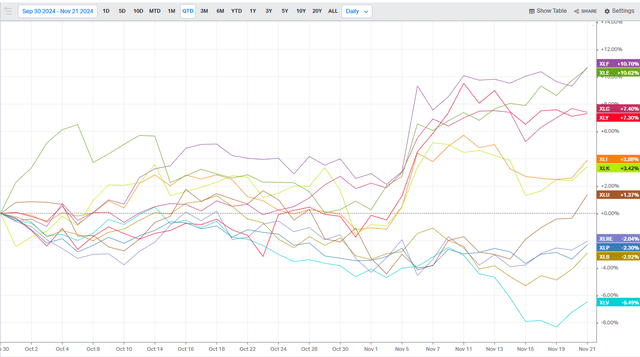
According to the issuer, XOP seeks to provide exposure to the oil and gas exploration and production segment of the S&P total market index, which comprises the following sub-industries: Integrated Oil & Gas, Oil & Gas Exploration & Production, and Oil & Gas Refining & Marketing. The fund's modified equal-weighted approach provides the potential for unconcentrated industry exposure across large, mid, and small-cap stocks.
XOP is a moderate-sized ETF with $2.7 billion in assets under management as of November 21, 2024. That’s down materially from $3.7 billion from both this past May and in October 2023 when I previously analyzed the fund. XOP has a low expense ratio, however, at just 0.35% while its forward dividend yield is about one percentage point above that of the S&P 500 at 2.36%.
Share-price momentum has improved markedly from this past summer, earning the ETF a solid B Grade from Seeking Alpha’s quantitative scoring system. Prospective investors should be aware that XOP can be quite volatile at times due to unease in the energy commodity markets – the Risk rating is weak at an F. Still, XOP is a highly liquid product given average daily trading volume of more than 2.6 million shares and a 30-day median bid/ask spread of only two basis points, per SSGA Funds.
Zooming into the portfolio, the 2-star, Bronze-rated ETF by Morningstar is heavily allocated to the value style. Just 4% of the allocation is considered growth, while 12% is in the blend category. Moreover, more than half of XOP is SMID cap in size, which only adds to its risk characteristics. But with a P/E ratio of less than 11, the value case remains compelling, particularly in light of its high 22.1% historical earnings growth rate.
XOP: Portfolio & Factor Profiles
Morningstar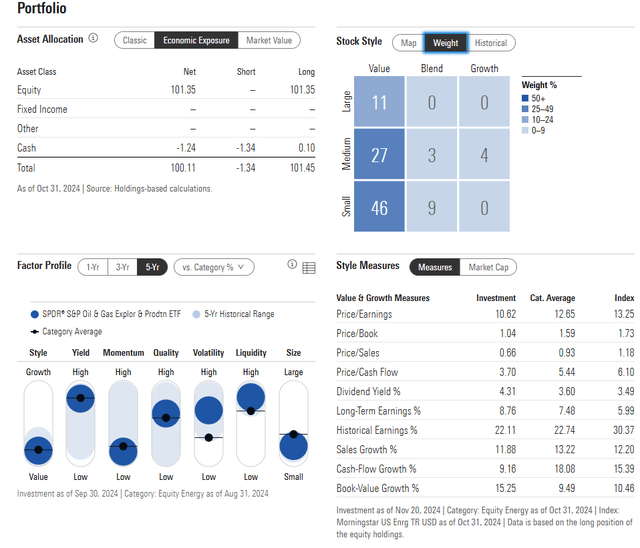
Being a 100% Energy sector fund, there’s added sensitivity to the global commodity markets, but the portfolio’s concentration is actually decently spread out.
The top 10 holdings account for less than one-third of the fund. Furthermore, the top positions operate in mixed corners of the overall oil & gas E&P area.
XOP: Holdings & Dividend Information
Seeking Alpha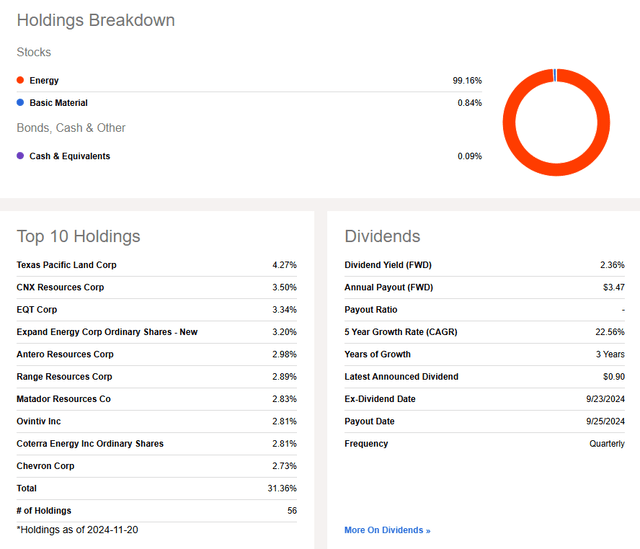
Seasonally, now is not an ideal time to be long XOP. This is a bearish risk prospective investors should weigh, though seasonal trends should take a back seat to fundamentals and the technical momentum outlook.
For now, though, the December through February period has historically been among the worst 3-month stretches on the calendar. So, being opportunistic over the weeks ahead could prove worthwhile.
XOP: December-February Weakness Possible
Seeking Alpha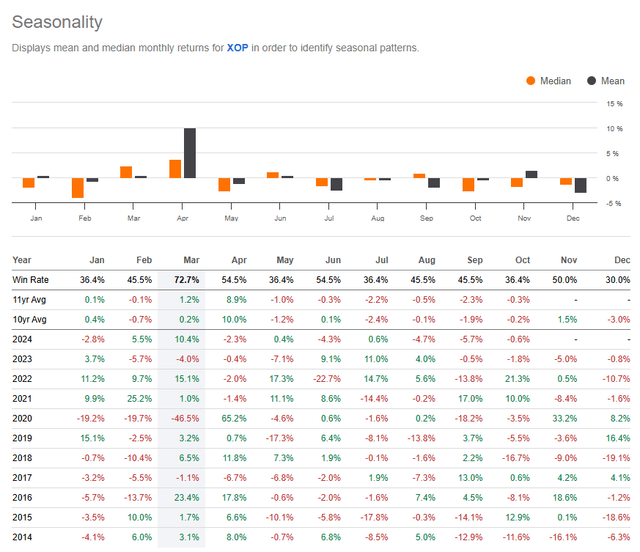
The Technical Take
With relative strength building and a low valuation ahead of seasonal weakness, XOP’s technical situation has improved. Notice in the chart below that the fund has broken out to its best level since July. Moreover, the fund is now back above both its long-term 200-day moving average and the nearer-term 50dma. While the 200dma is flat in its slope, the 50dma has inflected higher, and with price above both moving averages, there are bullish trend signals.
Shares also put it a bullish head and shoulders bottom pattern from Q3 into Q4. The $142 to $143 zone was the neckline, and with a breakout earlier this week, the upside measured move price objective is $160 based on the $18 range height from the neckline down to the head. That would bring XOP just below its YTD high of $162.49 from April. The mid-$120s has also emerged as a support area – that's where XOP bottomed in the first quarter.
Also take a look at the RSI momentum oscillator at the top of the graph – it confirms the upward price thrust, which is encouraging. What’s concerning, however, is a high amount of volume by price up to about $155 that may act as resistance into year-end.
XOP: Bullish Head and Shoulders Bottom Targets $160
Stockcharts.com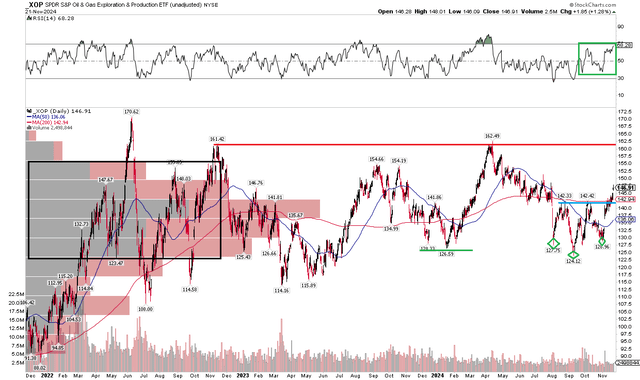
The Bottom Line
I reiterate a buy rating on XOP. The valuation remains compelling while the chart has turned more sanguine despite some seasonal headwinds on the horizon.
Disclaimer: Investing carries risk. This is not financial advice. The above content should not be regarded as an offer, recommendation, or solicitation on acquiring or disposing of any financial products, any associated discussions, comments, or posts by author or other users should not be considered as such either. It is solely for general information purpose only, which does not consider your own investment objectives, financial situations or needs. TTM assumes no responsibility or warranty for the accuracy and completeness of the information, investors should do their own research and may seek professional advice before investing.
Most Discussed
- 1
- 2
- 3
- 4
- 5
- 6
- 7
- 8
- 9
- 10