Estimating The Fair Value Of Haidilao International Holding Ltd. (HKG:6862)
Key Insights
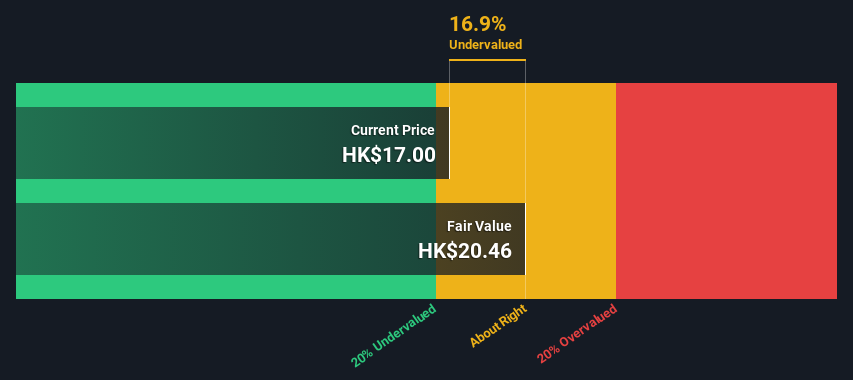
- The projected fair value for Haidilao International Holding is HK$20.46 based on 2 Stage Free Cash Flow to Equity
- Haidilao International Holding's HK$17.00 share price indicates it is trading at similar levels as its fair value estimate
- Our fair value estimate is 20% higher than Haidilao International Holding's analyst price target of CN¥17.03
Today we will run through one way of estimating the intrinsic value of Haidilao International Holding Ltd. (HKG:6862) by taking the expected future cash flows and discounting them to their present value. This will be done using the Discounted Cash Flow (DCF) model. Believe it or not, it's not too difficult to follow, as you'll see from our example!
We generally believe that a company's value is the present value of all of the cash it will generate in the future. However, a DCF is just one valuation metric among many, and it is not without flaws. If you still have some burning questions about this type of valuation, take a look at the Simply Wall St analysis model.
See our latest analysis for Haidilao International Holding
The Calculation
We use what is known as a 2-stage model, which simply means we have two different periods of growth rates for the company's cash flows. Generally the first stage is higher growth, and the second stage is a lower growth phase. To start off with, we need to estimate the next ten years of cash flows. Where possible we use analyst estimates, but when these aren't available we extrapolate the previous free cash flow (FCF) from the last estimate or reported value. We assume companies with shrinking free cash flow will slow their rate of shrinkage, and that companies with growing free cash flow will see their growth rate slow, over this period. We do this to reflect that growth tends to slow more in the early years than it does in later years.
Generally we assume that a dollar today is more valuable than a dollar in the future, so we need to discount the sum of these future cash flows to arrive at a present value estimate:
10-year free cash flow (FCF) estimate
| 2025 | 2026 | 2027 | 2028 | 2029 | 2030 | 2031 | 2032 | 2033 | 2034 | |
| Levered FCF (CN¥, Millions) | CN¥6.36b | CN¥6.63b | CN¥6.68b | CN¥6.77b | CN¥6.88b | CN¥7.00b | CN¥7.14b | CN¥7.29b | CN¥7.44b | CN¥7.61b |
| Growth Rate Estimate Source | Analyst x7 | Analyst x7 | Est @ 0.80% | Est @ 1.26% | Est @ 1.58% | Est @ 1.81% | Est @ 1.97% | Est @ 2.08% | Est @ 2.16% | Est @ 2.21% |
| Present Value (CN¥, Millions) Discounted @ 8.2% | CN¥5.9k | CN¥5.7k | CN¥5.3k | CN¥4.9k | CN¥4.6k | CN¥4.4k | CN¥4.1k | CN¥3.9k | CN¥3.7k | CN¥3.5k |
("Est" = FCF growth rate estimated by Simply Wall St)Present Value of 10-year Cash Flow (PVCF) = CN¥46b
After calculating the present value of future cash flows in the initial 10-year period, we need to calculate the Terminal Value, which accounts for all future cash flows beyond the first stage. For a number of reasons a very conservative growth rate is used that cannot exceed that of a country's GDP growth. In this case we have used the 5-year average of the 10-year government bond yield (2.3%) to estimate future growth. In the same way as with the 10-year 'growth' period, we discount future cash flows to today's value, using a cost of equity of 8.2%.
Terminal Value (TV)= FCF2034 × (1 + g) ÷ (r – g) = CN¥7.6b× (1 + 2.3%) ÷ (8.2%– 2.3%) = CN¥134b
Present Value of Terminal Value (PVTV)= TV / (1 + r)10= CN¥134b÷ ( 1 + 8.2%)10= CN¥61b
The total value is the sum of cash flows for the next ten years plus the discounted terminal value, which results in the Total Equity Value, which in this case is CN¥107b. The last step is to then divide the equity value by the number of shares outstanding. Relative to the current share price of HK$17.0, the company appears about fair value at a 17% discount to where the stock price trades currently. Remember though, that this is just an approximate valuation, and like any complex formula - garbage in, garbage out.
The Assumptions
We would point out that the most important inputs to a discounted cash flow are the discount rate and of course the actual cash flows. You don't have to agree with these inputs, I recommend redoing the calculations yourself and playing with them. The DCF also does not consider the possible cyclicality of an industry, or a company's future capital requirements, so it does not give a full picture of a company's potential performance. Given that we are looking at Haidilao International Holding as potential shareholders, the cost of equity is used as the discount rate, rather than the cost of capital (or weighted average cost of capital, WACC) which accounts for debt. In this calculation we've used 8.2%, which is based on a levered beta of 1.167. Beta is a measure of a stock's volatility, compared to the market as a whole. We get our beta from the industry average beta of globally comparable companies, with an imposed limit between 0.8 and 2.0, which is a reasonable range for a stable business.
SWOT Analysis for Haidilao International Holding
- Debt is not viewed as a risk.
- Balance sheet summary for 6862.
- Earnings growth over the past year underperformed the Hospitality industry.
- Dividend is low compared to the top 25% of dividend payers in the Hospitality market.
- Annual earnings are forecast to grow for the next 3 years.
- Current share price is below our estimate of fair value.
- Dividends are not covered by earnings.
- Annual earnings are forecast to grow slower than the Hong Kong market.
- See 6862's dividend history.
Next Steps:
Although the valuation of a company is important, it ideally won't be the sole piece of analysis you scrutinize for a company. DCF models are not the be-all and end-all of investment valuation. Preferably you'd apply different cases and assumptions and see how they would impact the company's valuation. If a company grows at a different rate, or if its cost of equity or risk free rate changes sharply, the output can look very different. For Haidilao International Holding, there are three essential factors you should consider:
- Risks: Case in point, we've spotted 2 warning signs for Haidilao International Holding you should be aware of.
- Management:Have insiders been ramping up their shares to take advantage of the market's sentiment for 6862's future outlook? Check out our management and board analysis with insights on CEO compensation and governance factors.
- Other High Quality Alternatives: Do you like a good all-rounder? Explore our interactive list of high quality stocks to get an idea of what else is out there you may be missing!
PS. The Simply Wall St app conducts a discounted cash flow valuation for every stock on the SEHK every day. If you want to find the calculation for other stocks just search here.
Valuation is complex, but we're here to simplify it.
Discover if Haidilao International Holding might be undervalued or overvalued with our detailed analysis, featuring fair value estimates, potential risks, dividends, insider trades, and its financial condition.
Access Free AnalysisHave feedback on this article? Concerned about the content? Get in touch with us directly. Alternatively, email editorial-team (at) simplywallst.com.This article by Simply Wall St is general in nature. We provide commentary based on historical data and analyst forecasts only using an unbiased methodology and our articles are not intended to be financial advice. It does not constitute a recommendation to buy or sell any stock, and does not take account of your objectives, or your financial situation. We aim to bring you long-term focused analysis driven by fundamental data. Note that our analysis may not factor in the latest price-sensitive company announcements or qualitative material. Simply Wall St has no position in any stocks mentioned.
Disclaimer: Investing carries risk. This is not financial advice. The above content should not be regarded as an offer, recommendation, or solicitation on acquiring or disposing of any financial products, any associated discussions, comments, or posts by author or other users should not be considered as such either. It is solely for general information purpose only, which does not consider your own investment objectives, financial situations or needs. TTM assumes no responsibility or warranty for the accuracy and completeness of the information, investors should do their own research and may seek professional advice before investing.
Most Discussed
- 1
- 2
- 3
- 4
- 5
- 6
- 7
- 8
- 9
- 10