Institutions own 41% of Sonic Healthcare Limited (ASX:SHL) shares but retail investors control 54% of the company
Key Insights
- The considerable ownership by retail investors in Sonic Healthcare indicates that they collectively have a greater say in management and business strategy
- A total of 25 investors have a majority stake in the company with 39% ownership
- Insiders have been buying lately
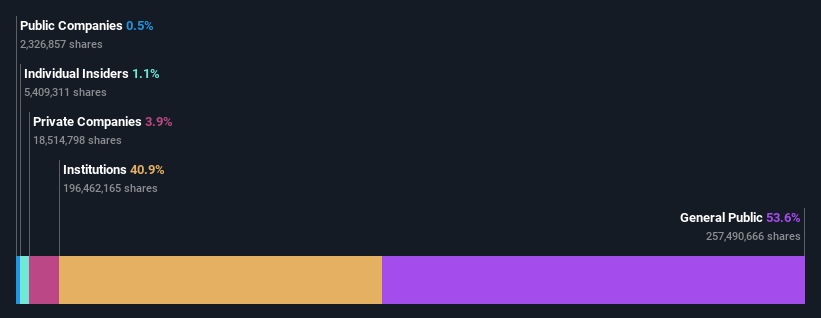
A look at the shareholders of Sonic Healthcare Limited (ASX:SHL) can tell us which group is most powerful. And the group that holds the biggest piece of the pie are retail investors with 54% ownership. Put another way, the group faces the maximum upside potential (or downside risk).
And institutions on the other hand have a 41% ownership in the company. Institutions often own shares in more established companies, while it's not unusual to see insiders own a fair bit of smaller companies.
In the chart below, we zoom in on the different ownership groups of Sonic Healthcare.
Check out our latest analysis for Sonic Healthcare
What Does The Institutional Ownership Tell Us About Sonic Healthcare?
Many institutions measure their performance against an index that approximates the local market. So they usually pay more attention to companies that are included in major indices.
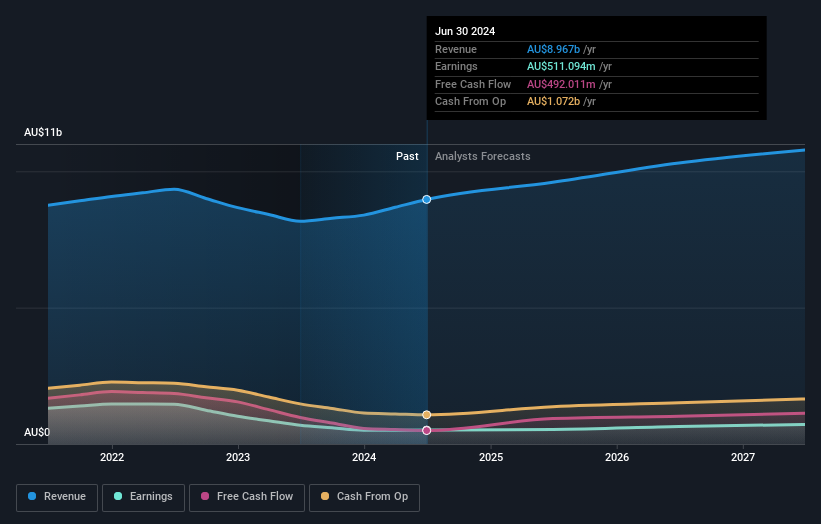
Sonic Healthcare already has institutions on the share registry. Indeed, they own a respectable stake in the company. This implies the analysts working for those institutions have looked at the stock and they like it. But just like anyone else, they could be wrong. When multiple institutions own a stock, there's always a risk that they are in a 'crowded trade'. When such a trade goes wrong, multiple parties may compete to sell stock fast. This risk is higher in a company without a history of growth. You can see Sonic Healthcare's historic earnings and revenue below, but keep in mind there's always more to the story.
Hedge funds don't have many shares in Sonic Healthcare. Looking at our data, we can see that the largest shareholder is State Street Global Advisors, Inc. with 7.4% of shares outstanding. In comparison, the second and third largest shareholders hold about 5.9% and 5.0% of the stock.
A deeper look at our ownership data shows that the top 25 shareholders collectively hold less than half of the register, suggesting a large group of small holders where no single shareholder has a majority.
While studying institutional ownership for a company can add value to your research, it is also a good practice to research analyst recommendations to get a deeper understand of a stock's expected performance. There are a reasonable number of analysts covering the stock, so it might be useful to find out their aggregate view on the future.
Insider Ownership Of Sonic Healthcare
The definition of company insiders can be subjective and does vary between jurisdictions. Our data reflects individual insiders, capturing board members at the very least. Company management run the business, but the CEO will answer to the board, even if he or she is a member of it.
Most consider insider ownership a positive because it can indicate the board is well aligned with other shareholders. However, on some occasions too much power is concentrated within this group.
Shareholders would probably be interested to learn that insiders own shares in Sonic Healthcare Limited. It is a very large company, and board members collectively own AU$149m worth of shares (at current prices). we sometimes take an interest in whether they have been buying or selling.
General Public Ownership
The general public, mostly comprising of individual investors, collectively holds 54% of Sonic Healthcare shares. With this amount of ownership, retail investors can collectively play a role in decisions that affect shareholder returns, such as dividend policies and the appointment of directors. They can also exercise the power to vote on acquisitions or mergers that may not improve profitability.
Private Company Ownership
Our data indicates that Private Companies hold 3.9%, of the company's shares. It's hard to draw any conclusions from this fact alone, so its worth looking into who owns those private companies. Sometimes insiders or other related parties have an interest in shares in a public company through a separate private company.
Next Steps:
I find it very interesting to look at who exactly owns a company. But to truly gain insight, we need to consider other information, too. Be aware that Sonic Healthcare is showing 2 warning signs in our investment analysis , and 1 of those doesn't sit too well with us...
If you are like me, you may want to think about whether this company will grow or shrink. Luckily, you can check this free report showing analyst forecasts for its future.
NB: Figures in this article are calculated using data from the last twelve months, which refer to the 12-month period ending on the last date of the month the financial statement is dated. This may not be consistent with full year annual report figures.
New: Manage All Your Stock Portfolios in One Place
We've created the ultimate portfolio companion for stock investors, and it's free.
• Connect an unlimited number of Portfolios and see your total in one currency• Be alerted to new Warning Signs or Risks via email or mobile• Track the Fair Value of your stocks
Try a Demo Portfolio for FreeHave feedback on this article? Concerned about the content? Get in touch with us directly. Alternatively, email editorial-team (at) simplywallst.com.This article by Simply Wall St is general in nature. We provide commentary based on historical data and analyst forecasts only using an unbiased methodology and our articles are not intended to be financial advice. It does not constitute a recommendation to buy or sell any stock, and does not take account of your objectives, or your financial situation. We aim to bring you long-term focused analysis driven by fundamental data. Note that our analysis may not factor in the latest price-sensitive company announcements or qualitative material. Simply Wall St has no position in any stocks mentioned.
Disclaimer: Investing carries risk. This is not financial advice. The above content should not be regarded as an offer, recommendation, or solicitation on acquiring or disposing of any financial products, any associated discussions, comments, or posts by author or other users should not be considered as such either. It is solely for general information purpose only, which does not consider your own investment objectives, financial situations or needs. TTM assumes no responsibility or warranty for the accuracy and completeness of the information, investors should do their own research and may seek professional advice before investing.
Most Discussed
- 1
- 2
- 3
- 4
- 5
- 6
- 7
- 8
- 9
- 10