Exploring High Growth Tech Stocks For January 2025
As global markets navigate a complex landscape marked by fluctuating consumer confidence and mixed economic indicators, the technology sector continues to capture investor attention with its potential for high growth. In this environment, identifying promising tech stocks involves assessing their innovation capabilities and adaptability to changing market dynamics.
Top 10 High Growth Tech Companies
| Name | Revenue Growth | Earnings Growth | Growth Rating |
|---|---|---|---|
| Seojin SystemLtd | 35.41% | 39.86% | ★★★★★★ |
| Yggdrazil Group | 30.20% | 87.10% | ★★★★★★ |
| eWeLLLtd | 26.41% | 28.82% | ★★★★★★ |
| Medley | 22.38% | 31.67% | ★★★★★★ |
| Mental Health TechnologiesLtd | 25.83% | 113.12% | ★★★★★★ |
| Pharma Mar | 25.43% | 56.19% | ★★★★★★ |
| TG Therapeutics | 30.06% | 45.28% | ★★★★★★ |
| Fine M-TecLTD | 36.52% | 131.08% | ★★★★★★ |
| JNTC | 29.48% | 104.37% | ★★★★★★ |
| Travere Therapeutics | 28.68% | 62.50% | ★★★★★★ |
Click here to see the full list of 1261 stocks from our High Growth Tech and AI Stocks screener.
Let's uncover some gems from our specialized screener.
Netcompany Group (CPSE:NETC)
Simply Wall St Growth Rating: ★★★★☆☆
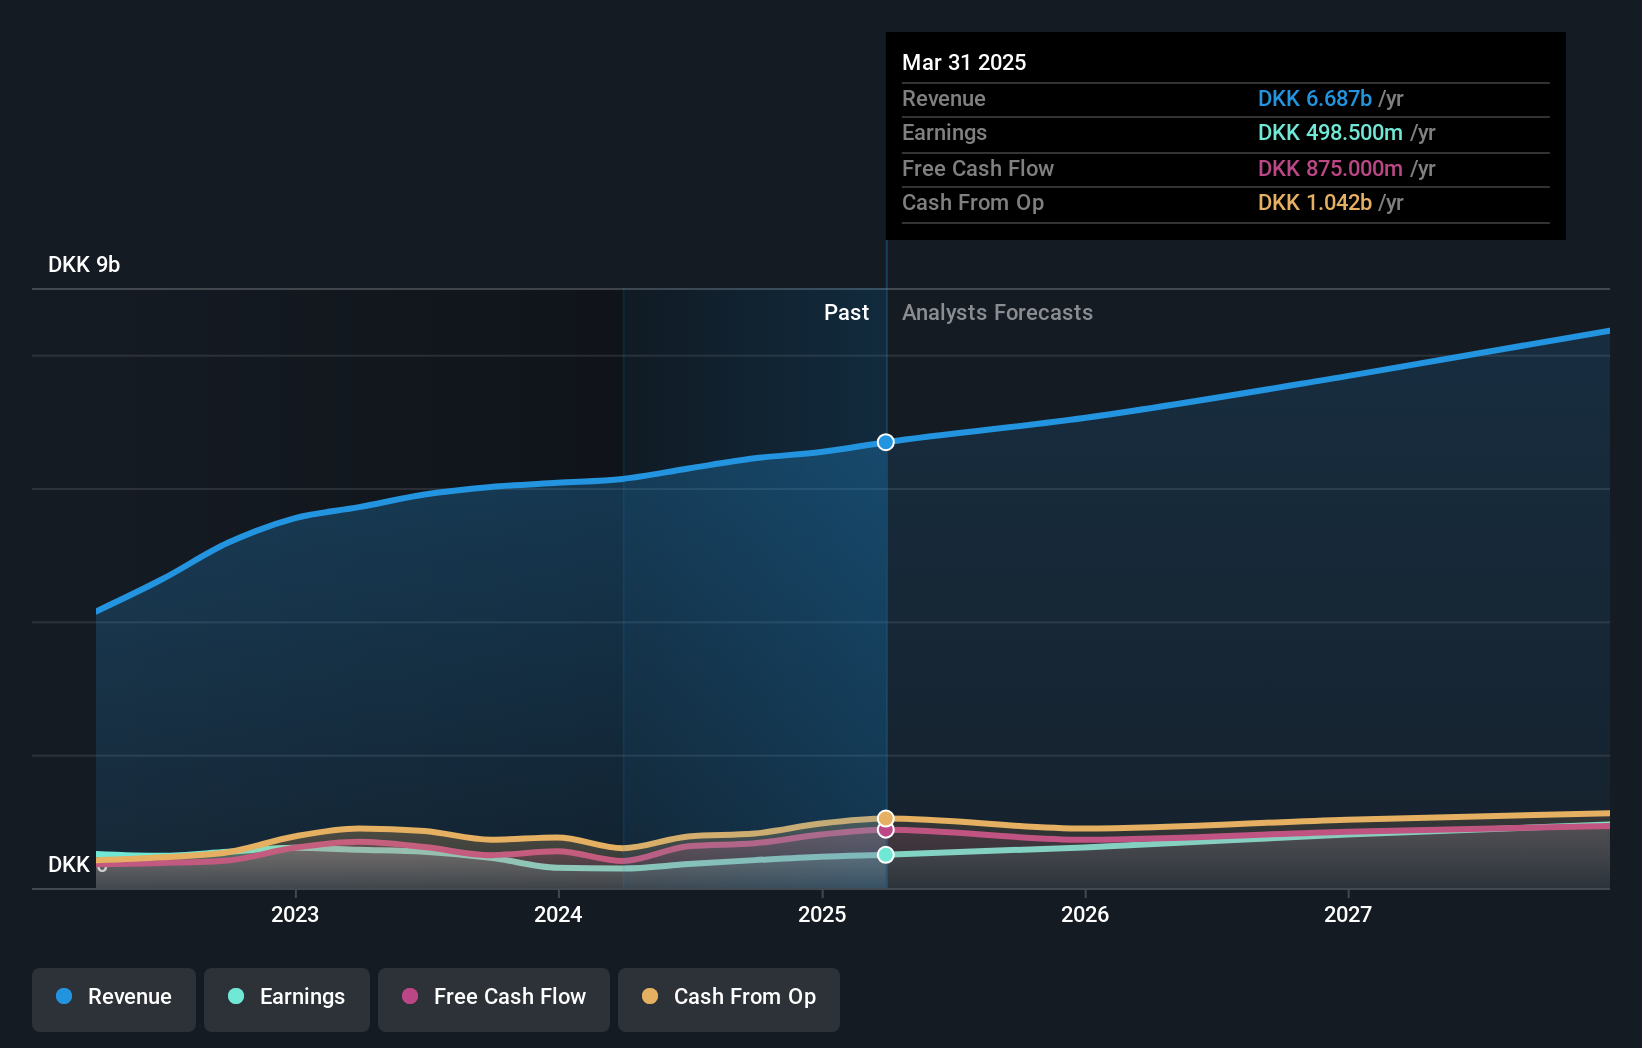
Overview: Netcompany Group A/S is an IT services company that provides essential IT solutions to public and private sector clients across several countries, including Denmark, Norway, the UK, and others, with a market cap of DKK16.09 billion.
Operations: With a market cap of DKK16.09 billion, Netcompany Group A/S generates revenue primarily from public sector clients, contributing DKK4.41 billion, and private sector clients at DKK2.04 billion across various countries including Denmark and Norway.
Netcompany Group has demonstrated a robust financial performance with third-quarter sales rising to DKK 1.61 billion, up from DKK 1.46 billion year-over-year, and net income nearly doubling to DKK 139.5 million. This growth is underpinned by an impressive annual earnings forecast of 29.5%, significantly outpacing the broader Danish market's average of 11.3%. Despite facing industry challenges with a previous year's earnings decline of 8%, the company maintains strong prospects with projected revenue growth at 10% annually, slightly lagging behind the market expectation of 11%. With high-quality earnings and a positive free cash flow stance, Netcompany is strategically positioned for sustained growth, leveraging its solid financial base and market performance to potentially enhance future profitability and shareholder value.
- Take a closer look at Netcompany Group's potential here in our health report.
Gain insights into Netcompany Group's historical performance by reviewing our past performance report.
SUNeVision Holdings (SEHK:1686)
Simply Wall St Growth Rating: ★★★★☆☆
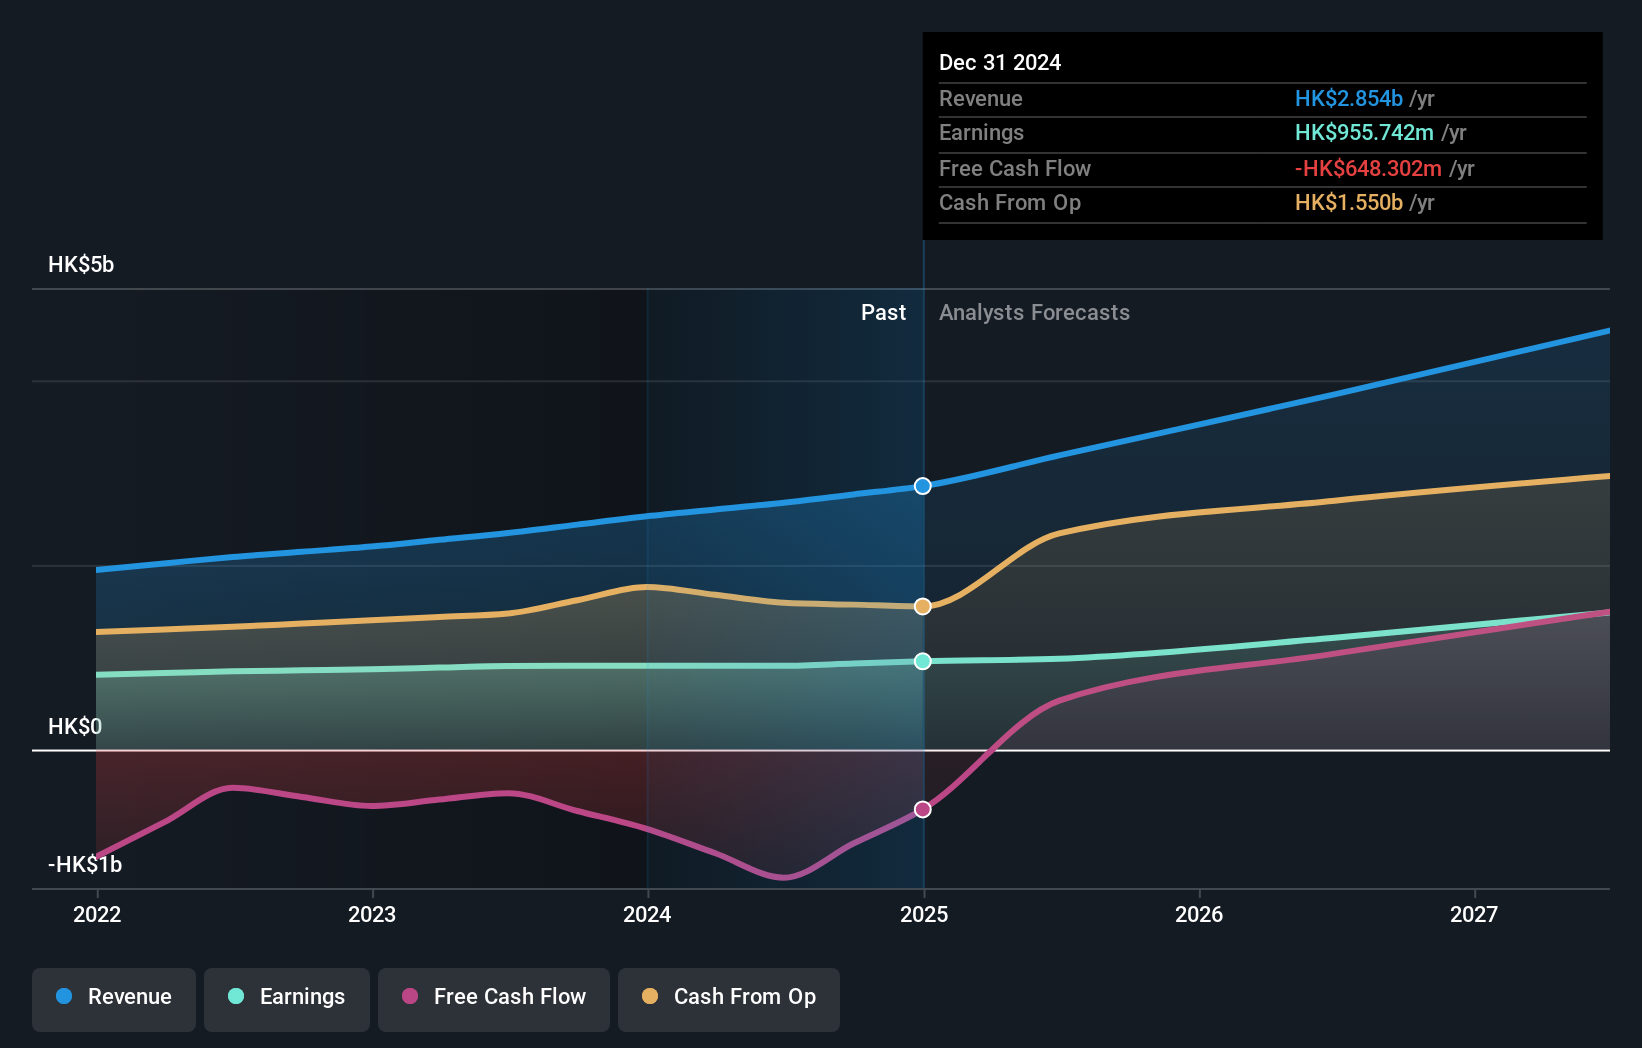
Overview: SUNeVision Holdings Ltd. is an investment holding company that offers data centre and IT facility services in Hong Kong, with a market capitalization of approximately HK$16.89 billion.
Operations: SUNeVision primarily generates revenue from its data centre and IT facility services, amounting to HK$2.46 billion, with additional income from Extra-Low Voltage (ELV) and IT systems contributing HK$213.03 million. The company's focus on these sectors highlights its role in supporting Hong Kong's digital infrastructure needs.
SUNeVision Holdings, with its recent adoption of new bylaws, demonstrates a proactive stance in governance, aligning with its robust financial trajectory. The company's revenue is expected to grow at 15% annually, outpacing the Hong Kong market average of 7.8%, while earnings are projected to rise by 13.7% each year, also above the local market forecast of 11.4%. This growth is further underscored by an impressive anticipated Return on Equity of 20.4% in three years, despite challenges like earnings only marginally increasing by 0.2% over the past year and a free cash flow position that remains negative. These figures highlight SUNeVision’s potential resilience and adaptability in a competitive IT landscape.
- Dive into the specifics of SUNeVision Holdings here with our thorough health report.
Understand SUNeVision Holdings' track record by examining our Past report.
Fositek (TWSE:6805)
Simply Wall St Growth Rating: ★★★★★★
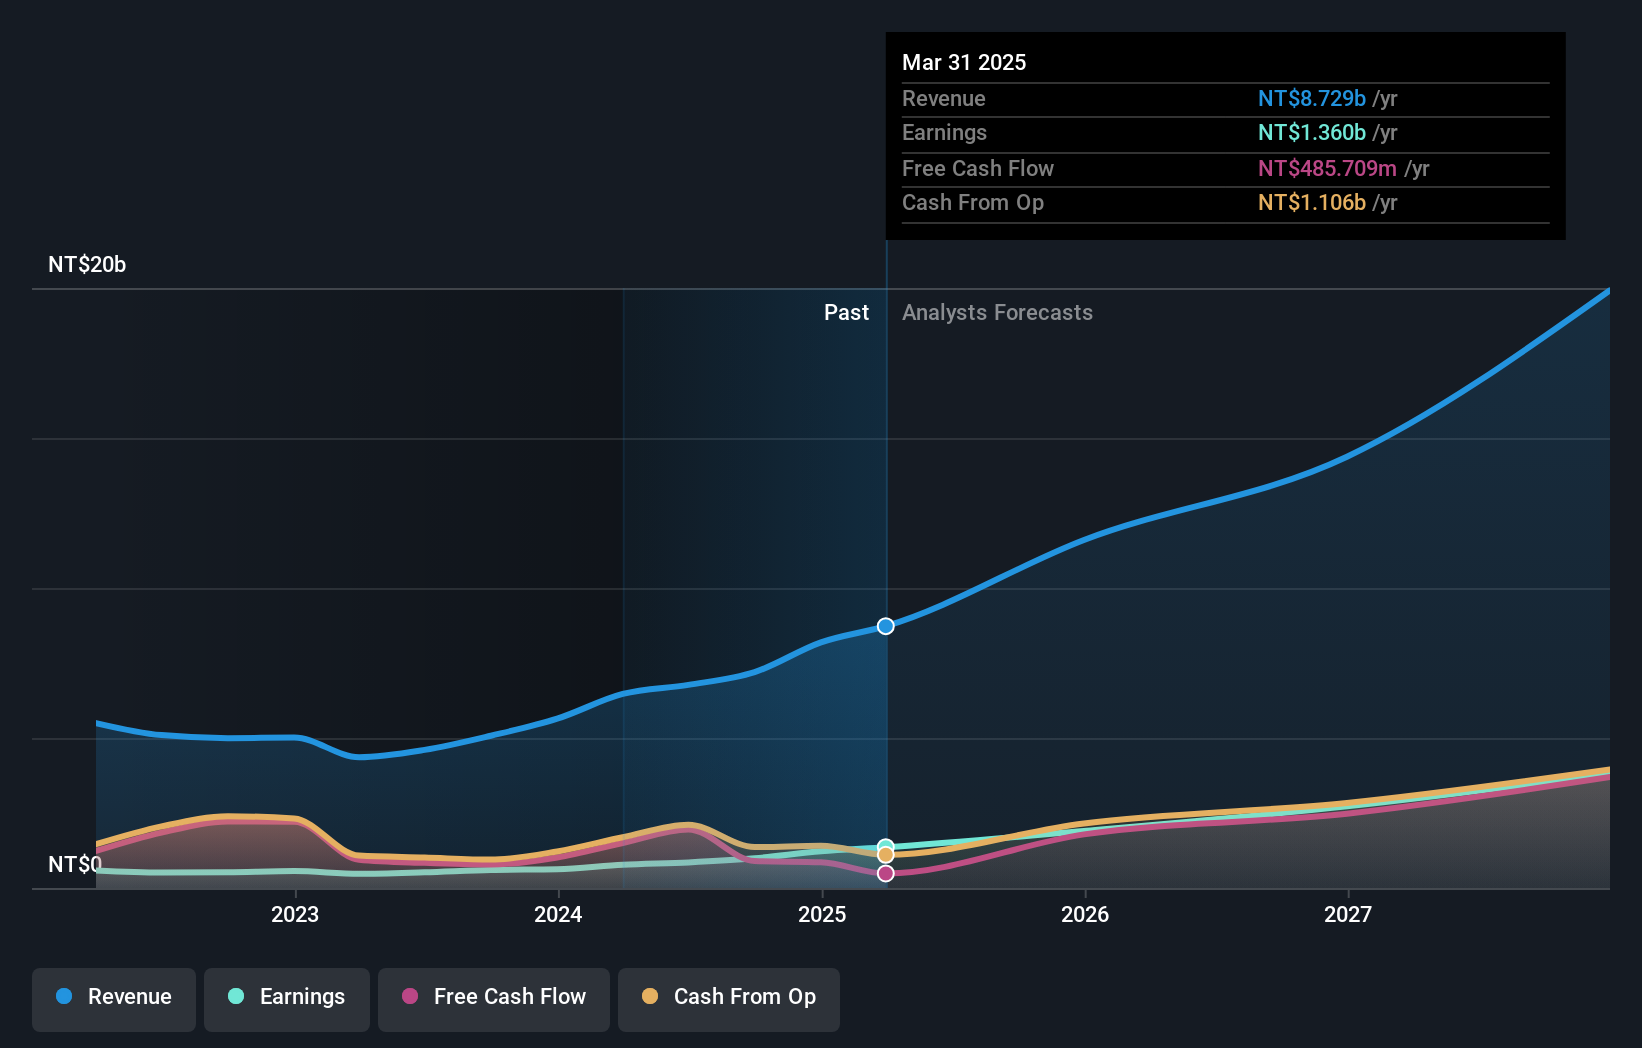
Overview: Fositek Corp. is involved in the manufacture and wholesale of electronic materials and components, with a market capitalization of NT$55.53 billion.
Operations: The company generates revenue primarily from the electronic components and parts segment, amounting to NT$7.20 billion.
Fositek Corp. stands out in the tech landscape with a remarkable annual revenue growth of 46.3% and earnings growth of 57.2%, significantly outpacing the broader Taiwanese market's averages. This performance is underpinned by substantial R&D investments, aligning with industry shifts towards advanced technologies and enhanced service offerings. At a recent conference, Fositek showcased strategies that could further harness AI capabilities, reflecting its proactive approach to embedding cutting-edge tech in its operations. These factors collectively underscore Fositek’s robust position in a competitive sector, poised for sustained growth driven by innovation and market responsiveness.
- Click to explore a detailed breakdown of our findings in Fositek's health report.
Review our historical performance report to gain insights into Fositek's's past performance.
Key Takeaways
- Navigate through the entire inventory of 1261 High Growth Tech and AI Stocks here.
- Have you diversified into these companies? Leverage the power of Simply Wall St's portfolio to keep a close eye on market movements affecting your investments.
- Join a community of smart investors by using Simply Wall St. It's free and delivers expert-level analysis on worldwide markets.
Searching for a Fresh Perspective?
- Explore high-performing small cap companies that haven't yet garnered significant analyst attention.
- Fuel your portfolio with companies showing strong growth potential, backed by optimistic outlooks both from analysts and management.
- Find companies with promising cash flow potential yet trading below their fair value.
This article by Simply Wall St is general in nature. We provide commentary based on historical data and analyst forecasts only using an unbiased methodology and our articles are not intended to be financial advice. It does not constitute a recommendation to buy or sell any stock, and does not take account of your objectives, or your financial situation. We aim to bring you long-term focused analysis driven by fundamental data. Note that our analysis may not factor in the latest price-sensitive company announcements or qualitative material. Simply Wall St has no position in any stocks mentioned.
New: Manage All Your Stock Portfolios in One Place
We've created the ultimate portfolio companion for stock investors, and it's free.
• Connect an unlimited number of Portfolios and see your total in one currency• Be alerted to new Warning Signs or Risks via email or mobile• Track the Fair Value of your stocks
Try a Demo Portfolio for FreeHave feedback on this article? Concerned about the content? Get in touch with us directly. Alternatively, email editorial-team@simplywallst.com
Disclaimer: Investing carries risk. This is not financial advice. The above content should not be regarded as an offer, recommendation, or solicitation on acquiring or disposing of any financial products, any associated discussions, comments, or posts by author or other users should not be considered as such either. It is solely for general information purpose only, which does not consider your own investment objectives, financial situations or needs. TTM assumes no responsibility or warranty for the accuracy and completeness of the information, investors should do their own research and may seek professional advice before investing.
Most Discussed
- 1
- 2
- 3
- 4
- 5
- 6
- 7
- 8
- 9
- 10