Celestia (TIA) Faces Potential 9% Decline Amid Growing Bearish Pressure
- Celestia price drops 15% in 24 hours, with bearish signals like a death cross and rising ADX confirming growing selling pressure.
- TIA trades below the Ichimoku Cloud, reinforcing bearish momentum, as support at $4.54 remains critical for preventing further declines.
- A breakdown below $4.54 could push TIA to $4.1, while a recovery above $5.5 would indicate a potential trend reversal.
Celestia’s (TIA) price has fallen sharply, dropping more than 15% in the last 24 hours and almost 40% over the past 30 days. Its market cap is now $2.2 billion, and this decline comes as bearish signals dominate technical indicators, including a recently formed death cross that suggests the potential for further downside.
While TIA holds the above key support at $4.54, the overall market sentiment remains negative. A recovery would require breaking through resistance at $5.50, but current trends indicate sellers are firmly in control.
TIA Downtrend Is Getting Stronger
The Average Directional Index (ADX) for TIA currently stands at 35.2, rising from 31.2 just one day ago, signaling a strengthening trend. The ADX measures the strength of a trend, whether bullish or bearish, on a scale from 0 to 100, with values above 25 indicating a strong trend and below 20 reflecting weak or absent momentum.
The rising ADX confirms that TIA’s current downtrend is gaining traction, highlighting increased selling pressure in the market.
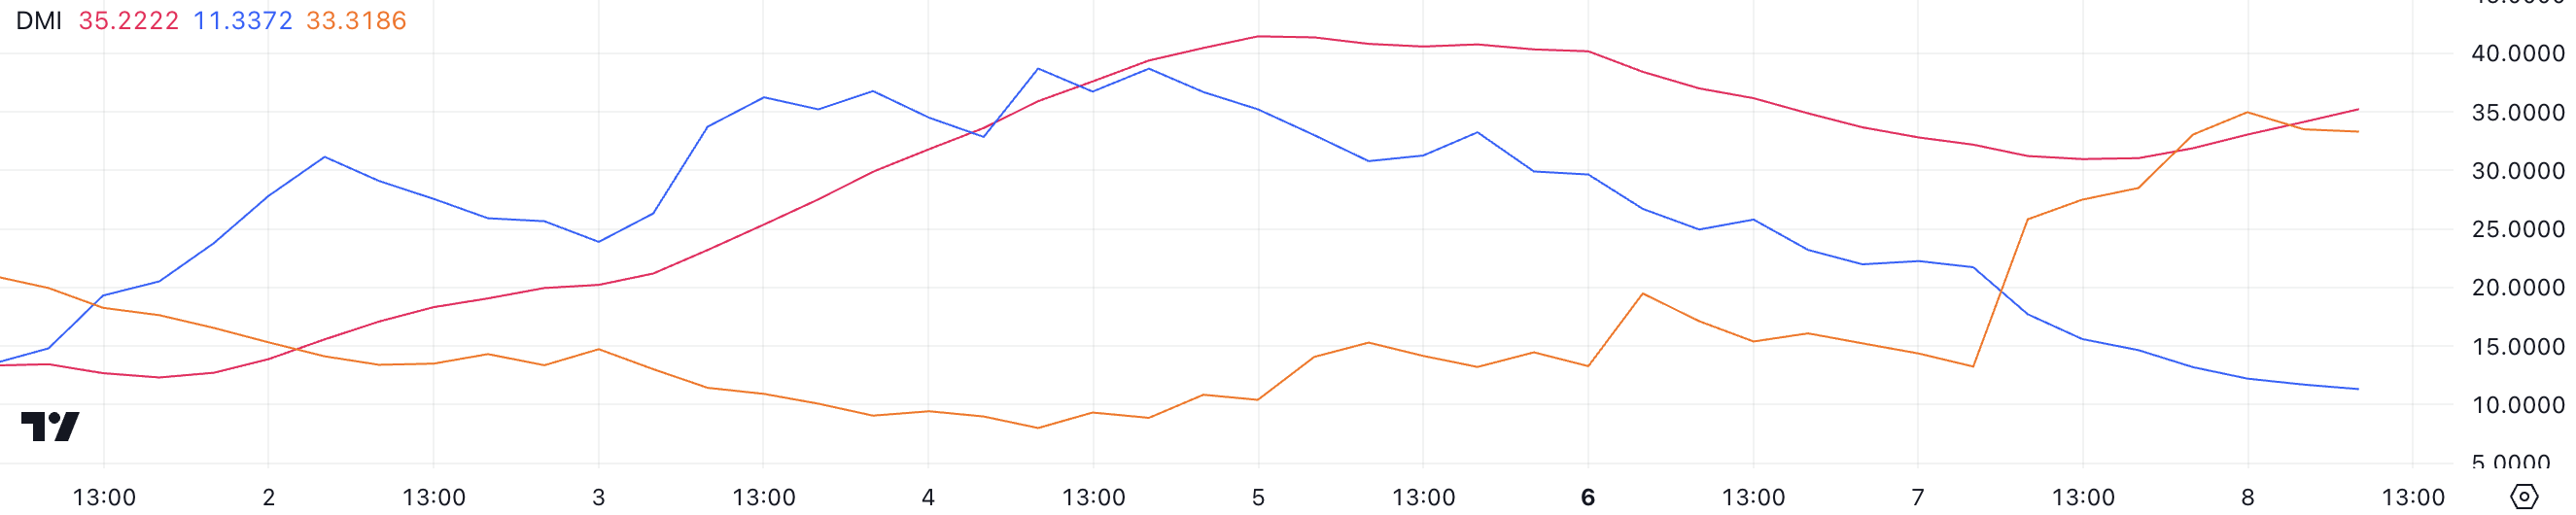
The directional indicators provide further insight into the trend’s dynamics. The +DI, which represents buying pressure, has fallen sharply from 22.2 to 11.3, reflecting a significant weakening of bullish momentum. Meanwhile, the -DI, indicating selling pressure, has surged from 14.3 to 33.3, signaling growing bearish activity.
This combination of declining +DI and rising -DI confirms that sellers are firmly in control. This suggests that Celestia price could continue to face downward pressure unless buying interest resurges to counteract the bearish momentum.
Ichimoku Cloud Shows a Bearish Momentum for Celestia
Ichimoku Cloud shows TIA price dropped well below the cloud, indicating a strong downtrend. The red cloud (Senkou Span A and Senkou Span B) further reflects resistance overhead, as its slope is flat but still positioned above the price, suggesting no immediate reversal in sentiment.
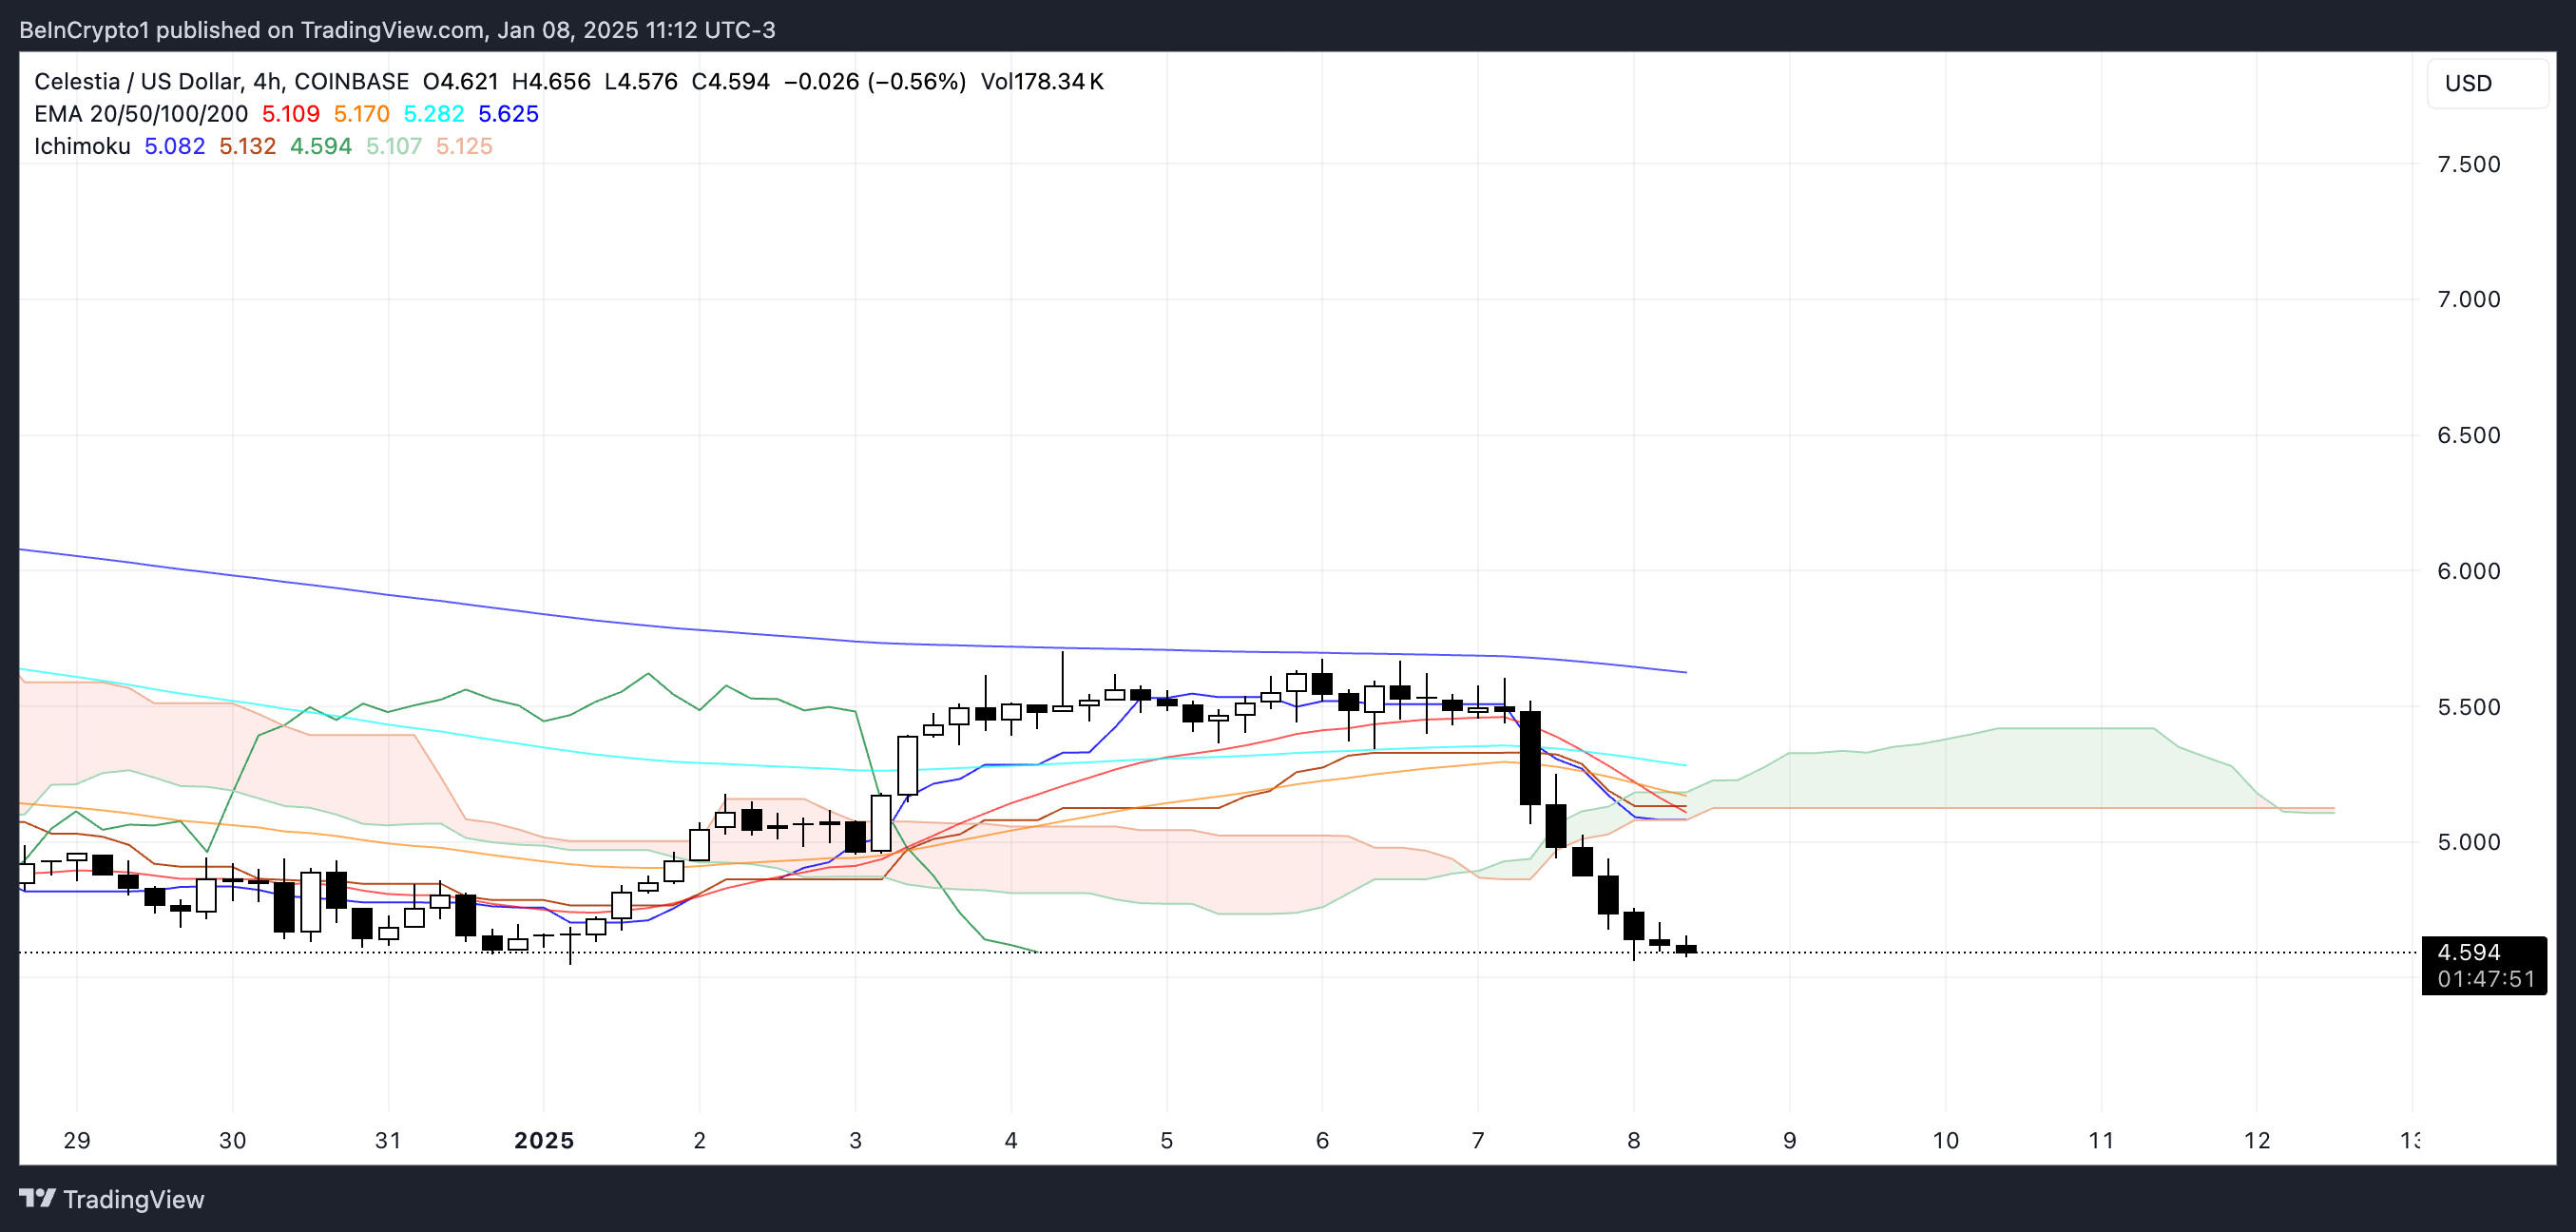
The blue line (Tenkan-sen) and the orange line (Kijun-sen) have diverged, with the blue line below the orange, confirming the bearish momentum.
Additionally, the green lagging span (Chikou Span) is situated below the cloud and price, reinforcing the downtrend and the dominance of bearish sentiment in the current market setup. For any signs of recovery, TIA would need to break back into the cloud, which appears unlikely based on current indicators.
TIA Price Prediction: Will It Test $4.10 Soon?
The recent formation of a death cross for Celestia has intensified its bearish momentum, causing more price declines. A death cross occurs when a short-term moving average crosses below a long-term moving average, signaling a potential shift into a more prolonged downtrend.
This technical development suggests that bearish sentiment is currently dominant, adding downward pressure to TIA price movement.
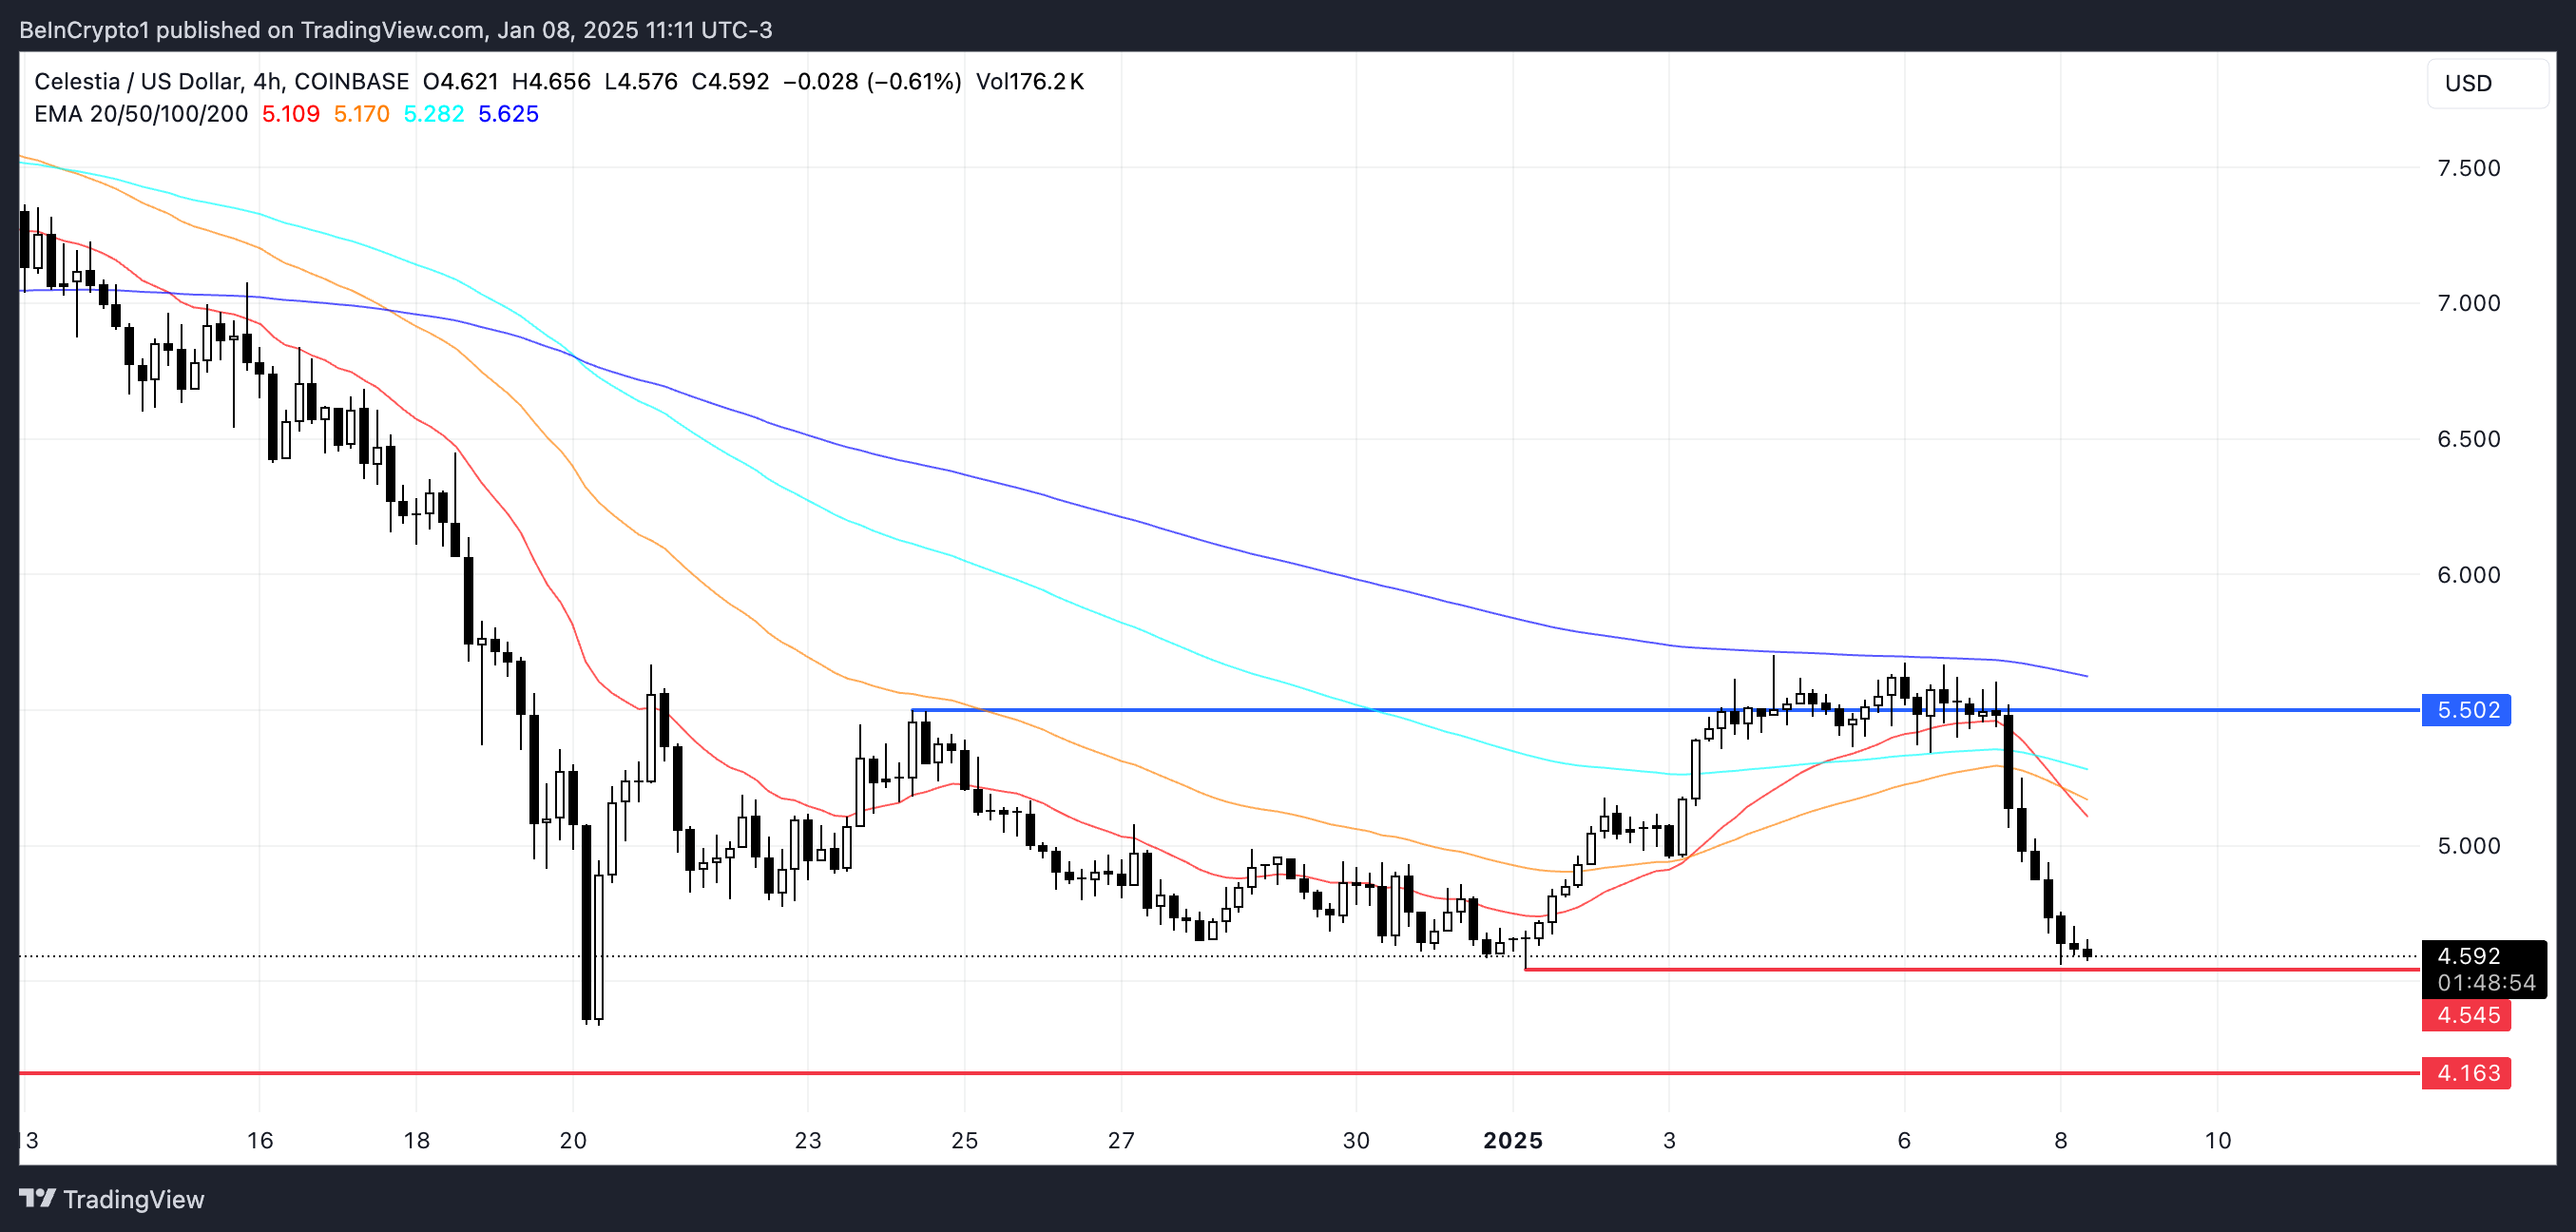
Despite the bearish setup, TIA price still holds a critical support level at $4.54. If this support is broken, the price could continue its descent toward $4.16, signaling a deeper correction.
Conversely, if TIA manages to recover and establish an uptrend, the price could aim for its nearest strong resistance at $5.50.
Disclaimer: Investing carries risk. This is not financial advice. The above content should not be regarded as an offer, recommendation, or solicitation on acquiring or disposing of any financial products, any associated discussions, comments, or posts by author or other users should not be considered as such either. It is solely for general information purpose only, which does not consider your own investment objectives, financial situations or needs. TTM assumes no responsibility or warranty for the accuracy and completeness of the information, investors should do their own research and may seek professional advice before investing.
Most Discussed
- 1
- 2
- 3
- 4
- 5
- 6
- 7
- 8
- 9
- 10