Shandong Molong Petroleum Machinery (HKG:568) shareholders have endured a 74% loss from investing in the stock three years ago
It's not possible to invest over long periods without making some bad investments. But you want to avoid the really big losses like the plague. So take a moment to sympathize with the long term shareholders of Shandong Molong Petroleum Machinery Company Limited (HKG:568), who have seen the share price tank a massive 74% over a three year period. That would certainly shake our confidence in the decision to own the stock. The more recent news is of little comfort, with the share price down 45% in a year. More recently, the share price has dropped a further 11% in a month.
Since shareholders are down over the longer term, lets look at the underlying fundamentals over the that time and see if they've been consistent with returns.
Check out our latest analysis for Shandong Molong Petroleum Machinery
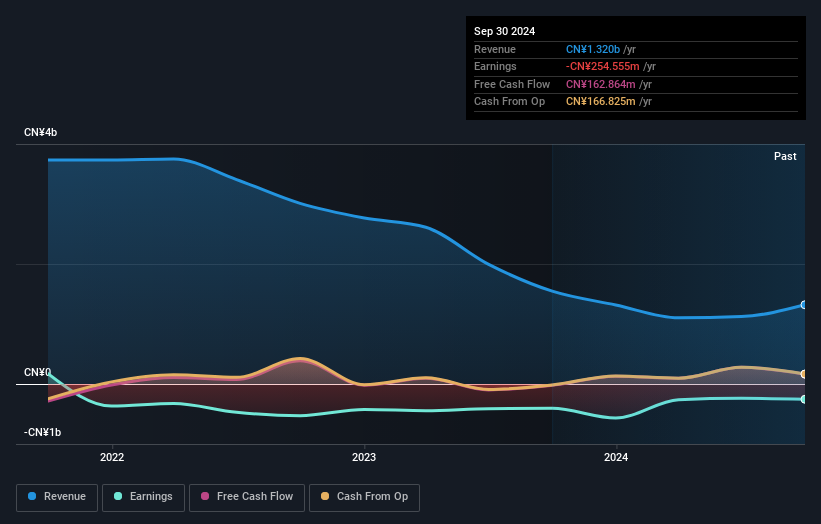
Shandong Molong Petroleum Machinery wasn't profitable in the last twelve months, it is unlikely we'll see a strong correlation between its share price and its earnings per share (EPS). Arguably revenue is our next best option. When a company doesn't make profits, we'd generally hope to see good revenue growth. That's because it's hard to be confident a company will be sustainable if revenue growth is negligible, and it never makes a profit.
Over the last three years, Shandong Molong Petroleum Machinery's revenue dropped 44% per year. That means its revenue trend is very weak compared to other loss making companies. And as you might expect the share price has been weak too, dropping at a rate of 20% per year. Never forget that loss making companies with falling revenue can and do cause losses for everyday investors. There is a good reason that investors often describe buying a sharply falling stock price as 'trying to catch a falling knife'. Think about it.
You can see below how earnings and revenue have changed over time (discover the exact values by clicking on the image).
This free interactive report on Shandong Molong Petroleum Machinery's balance sheet strength is a great place to start, if you want to investigate the stock further.
A Different Perspective
While the broader market gained around 27% in the last year, Shandong Molong Petroleum Machinery shareholders lost 45%. Even the share prices of good stocks drop sometimes, but we want to see improvements in the fundamental metrics of a business, before getting too interested. Longer term investors wouldn't be so upset, since they would have made 6%, each year, over five years. If the fundamental data continues to indicate long term sustainable growth, the current sell-off could be an opportunity worth considering. It's always interesting to track share price performance over the longer term. But to understand Shandong Molong Petroleum Machinery better, we need to consider many other factors. For instance, we've identified 1 warning sign for Shandong Molong Petroleum Machinery that you should be aware of.
If you are like me, then you will not want to miss this free list of undervalued small caps that insiders are buying.
Please note, the market returns quoted in this article reflect the market weighted average returns of stocks that currently trade on Hong Kong exchanges.
New: Manage All Your Stock Portfolios in One Place
We've created the ultimate portfolio companion for stock investors, and it's free.
• Connect an unlimited number of Portfolios and see your total in one currency• Be alerted to new Warning Signs or Risks via email or mobile• Track the Fair Value of your stocks
Try a Demo Portfolio for FreeHave feedback on this article? Concerned about the content? Get in touch with us directly. Alternatively, email editorial-team (at) simplywallst.com.This article by Simply Wall St is general in nature. We provide commentary based on historical data and analyst forecasts only using an unbiased methodology and our articles are not intended to be financial advice. It does not constitute a recommendation to buy or sell any stock, and does not take account of your objectives, or your financial situation. We aim to bring you long-term focused analysis driven by fundamental data. Note that our analysis may not factor in the latest price-sensitive company announcements or qualitative material. Simply Wall St has no position in any stocks mentioned.
Disclaimer: Investing carries risk. This is not financial advice. The above content should not be regarded as an offer, recommendation, or solicitation on acquiring or disposing of any financial products, any associated discussions, comments, or posts by author or other users should not be considered as such either. It is solely for general information purpose only, which does not consider your own investment objectives, financial situations or needs. TTM assumes no responsibility or warranty for the accuracy and completeness of the information, investors should do their own research and may seek professional advice before investing.
Most Discussed
- 1
- 2
- 3
- 4
- 5
- 6
- 7
- 8
- 9
- 10