The Market Doesn't Like What It Sees From MedAdvisor Limited's (ASX:MDR) Revenues Yet As Shares Tumble 27%
MedAdvisor Limited (ASX:MDR) shareholders that were waiting for something to happen have been dealt a blow with a 27% share price drop in the last month. Instead of being rewarded, shareholders who have already held through the last twelve months are now sitting on a 35% share price drop.
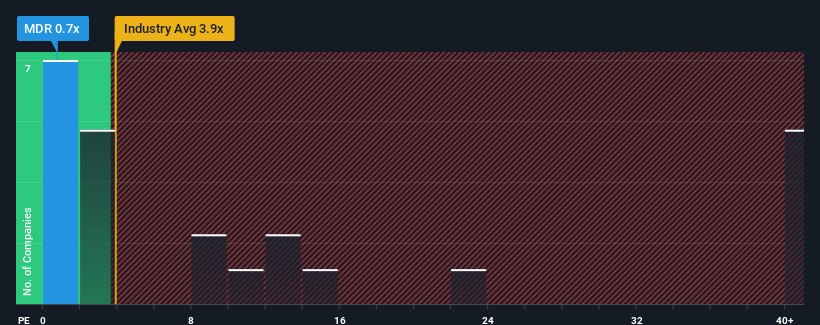
Even after such a large drop in price, MedAdvisor may still look like a strong buying opportunity at present with its price-to-sales (or "P/S") ratio of 0.7x, considering almost half of all companies in the Healthcare Services industry in Australia have P/S ratios greater than 10.3x and even P/S higher than 41x aren't out of the ordinary. However, the P/S might be quite low for a reason and it requires further investigation to determine if it's justified.
Check out our latest analysis for MedAdvisor
How Has MedAdvisor Performed Recently?
Recent times haven't been great for MedAdvisor as its revenue has been rising slower than most other companies. It seems that many are expecting the uninspiring revenue performance to persist, which has repressed the growth of the P/S ratio. If this is the case, then existing shareholders will probably struggle to get excited about the future direction of the share price.
Keen to find out how analysts think MedAdvisor's future stacks up against the industry? In that case, our free report is a great place to start.What Are Revenue Growth Metrics Telling Us About The Low P/S?
MedAdvisor's P/S ratio would be typical for a company that's expected to deliver very poor growth or even falling revenue, and importantly, perform much worse than the industry.
Taking a look back first, we see that the company grew revenue by an impressive 25% last year. Pleasingly, revenue has also lifted 215% in aggregate from three years ago, thanks to the last 12 months of growth. Therefore, it's fair to say the revenue growth recently has been superb for the company.
Turning to the outlook, the next three years should generate growth of 3.6% per annum as estimated by the three analysts watching the company. That's shaping up to be materially lower than the 36% each year growth forecast for the broader industry.
In light of this, it's understandable that MedAdvisor's P/S sits below the majority of other companies. It seems most investors are expecting to see limited future growth and are only willing to pay a reduced amount for the stock.
What Does MedAdvisor's P/S Mean For Investors?
Having almost fallen off a cliff, MedAdvisor's share price has pulled its P/S way down as well. We'd say the price-to-sales ratio's power isn't primarily as a valuation instrument but rather to gauge current investor sentiment and future expectations.
As expected, our analysis of MedAdvisor's analyst forecasts confirms that the company's underwhelming revenue outlook is a major contributor to its low P/S. Shareholders' pessimism on the revenue prospects for the company seems to be the main contributor to the depressed P/S. The company will need a change of fortune to justify the P/S rising higher in the future.
You always need to take note of risks, for example - MedAdvisor has 1 warning sign we think you should be aware of.
If strong companies turning a profit tickle your fancy, then you'll want to check out this free list of interesting companies that trade on a low P/E (but have proven they can grow earnings).
New: Manage All Your Stock Portfolios in One Place
We've created the ultimate portfolio companion for stock investors, and it's free.
• Connect an unlimited number of Portfolios and see your total in one currency• Be alerted to new Warning Signs or Risks via email or mobile• Track the Fair Value of your stocks
Try a Demo Portfolio for FreeHave feedback on this article? Concerned about the content? Get in touch with us directly. Alternatively, email editorial-team (at) simplywallst.com.This article by Simply Wall St is general in nature. We provide commentary based on historical data and analyst forecasts only using an unbiased methodology and our articles are not intended to be financial advice. It does not constitute a recommendation to buy or sell any stock, and does not take account of your objectives, or your financial situation. We aim to bring you long-term focused analysis driven by fundamental data. Note that our analysis may not factor in the latest price-sensitive company announcements or qualitative material. Simply Wall St has no position in any stocks mentioned.
Disclaimer: Investing carries risk. This is not financial advice. The above content should not be regarded as an offer, recommendation, or solicitation on acquiring or disposing of any financial products, any associated discussions, comments, or posts by author or other users should not be considered as such either. It is solely for general information purpose only, which does not consider your own investment objectives, financial situations or needs. TTM assumes no responsibility or warranty for the accuracy and completeness of the information, investors should do their own research and may seek professional advice before investing.
Most Discussed
- 1
- 2
- 3
- 4
- 5
- 6
- 7
- 8
- 9
- 10