Youdao, Inc.'s (NYSE:DAO) 29% Price Boost Is Out Of Tune With Revenues
Despite an already strong run, Youdao, Inc. (NYSE:DAO) shares have been powering on, with a gain of 29% in the last thirty days. The last month tops off a massive increase of 139% in the last year.
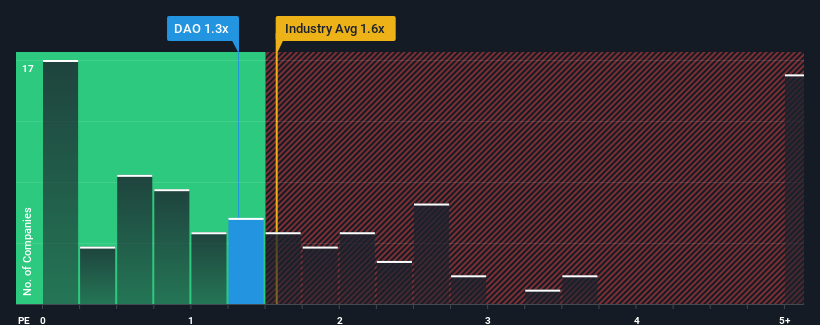
In spite of the firm bounce in price, there still wouldn't be many who think Youdao's price-to-sales (or "P/S") ratio of 1.3x is worth a mention when the median P/S in the United States' Consumer Services industry is similar at about 1.6x. Although, it's not wise to simply ignore the P/S without explanation as investors may be disregarding a distinct opportunity or a costly mistake.
See our latest analysis for Youdao
How Has Youdao Performed Recently?
With revenue growth that's inferior to most other companies of late, Youdao has been relatively sluggish. One possibility is that the P/S ratio is moderate because investors think this lacklustre revenue performance will turn around. However, if this isn't the case, investors might get caught out paying too much for the stock.
Want the full picture on analyst estimates for the company? Then our free report on Youdao will help you uncover what's on the horizon.What Are Revenue Growth Metrics Telling Us About The P/S?
In order to justify its P/S ratio, Youdao would need to produce growth that's similar to the industry.
Retrospectively, the last year delivered a decent 7.5% gain to the company's revenues. The latest three year period has also seen an excellent 68% overall rise in revenue, aided somewhat by its short-term performance. Accordingly, shareholders would have definitely welcomed those medium-term rates of revenue growth.
Shifting to the future, estimates from the seven analysts covering the company suggest revenue should grow by 10% over the next year. With the industry predicted to deliver 13% growth, the company is positioned for a weaker revenue result.
With this information, we find it interesting that Youdao is trading at a fairly similar P/S compared to the industry. Apparently many investors in the company are less bearish than analysts indicate and aren't willing to let go of their stock right now. Maintaining these prices will be difficult to achieve as this level of revenue growth is likely to weigh down the shares eventually.
The Final Word
Its shares have lifted substantially and now Youdao's P/S is back within range of the industry median. It's argued the price-to-sales ratio is an inferior measure of value within certain industries, but it can be a powerful business sentiment indicator.
When you consider that Youdao's revenue growth estimates are fairly muted compared to the broader industry, it's easy to see why we consider it unexpected to be trading at its current P/S ratio. When we see companies with a relatively weaker revenue outlook compared to the industry, we suspect the share price is at risk of declining, sending the moderate P/S lower. This places shareholders' investments at risk and potential investors in danger of paying an unnecessary premium.
It's always necessary to consider the ever-present spectre of investment risk. We've identified 3 warning signs with Youdao (at least 2 which are concerning), and understanding these should be part of your investment process.
It's important to make sure you look for a great company, not just the first idea you come across. So if growing profitability aligns with your idea of a great company, take a peek at this free list of interesting companies with strong recent earnings growth (and a low P/E).
New: Manage All Your Stock Portfolios in One Place
We've created the ultimate portfolio companion for stock investors, and it's free.
• Connect an unlimited number of Portfolios and see your total in one currency• Be alerted to new Warning Signs or Risks via email or mobile• Track the Fair Value of your stocks
Try a Demo Portfolio for FreeHave feedback on this article? Concerned about the content? Get in touch with us directly. Alternatively, email editorial-team (at) simplywallst.com.This article by Simply Wall St is general in nature. We provide commentary based on historical data and analyst forecasts only using an unbiased methodology and our articles are not intended to be financial advice. It does not constitute a recommendation to buy or sell any stock, and does not take account of your objectives, or your financial situation. We aim to bring you long-term focused analysis driven by fundamental data. Note that our analysis may not factor in the latest price-sensitive company announcements or qualitative material. Simply Wall St has no position in any stocks mentioned.
Disclaimer: Investing carries risk. This is not financial advice. The above content should not be regarded as an offer, recommendation, or solicitation on acquiring or disposing of any financial products, any associated discussions, comments, or posts by author or other users should not be considered as such either. It is solely for general information purpose only, which does not consider your own investment objectives, financial situations or needs. TTM assumes no responsibility or warranty for the accuracy and completeness of the information, investors should do their own research and may seek professional advice before investing.
Most Discussed
- 1
- 2
- 3
- 4
- 5
- 6
- 7
- 8
- 9
- 10