Calculating The Intrinsic Value Of Tianneng Power International Limited (HKG:819)
Key Insights
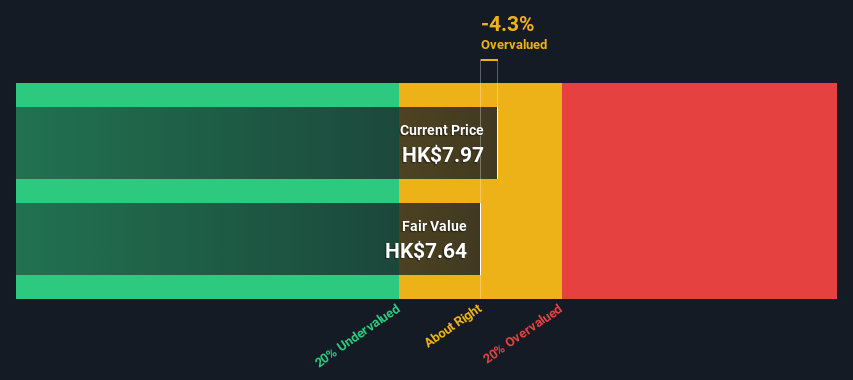
- Tianneng Power International's estimated fair value is HK$7.64 based on Dividend Discount Model
- With HK$7.97 share price, Tianneng Power International appears to be trading close to its estimated fair value
- The CN¥8.64 analyst price target for 819 is 13% more than our estimate of fair value
In this article we are going to estimate the intrinsic value of Tianneng Power International Limited (HKG:819) by taking the expected future cash flows and discounting them to their present value. Our analysis will employ the Discounted Cash Flow (DCF) model. Before you think you won't be able to understand it, just read on! It's actually much less complex than you'd imagine.
We generally believe that a company's value is the present value of all of the cash it will generate in the future. However, a DCF is just one valuation metric among many, and it is not without flaws. Anyone interested in learning a bit more about intrinsic value should have a read of the Simply Wall St analysis model.
View our latest analysis for Tianneng Power International
Crunching The Numbers
As Tianneng Power International operates in the auto components sector, we need to calculate the intrinsic value slightly differently. In this approach dividends per share (DPS) are used, as free cash flow is difficult to estimate and often not reported by analysts. Unless a company pays out the majority of its FCF as a dividend, this method will typically underestimate the value of the stock. The 'Gordon Growth Model' is used, which simply assumes that dividend payments will continue to increase at a sustainable growth rate forever. For a number of reasons a very conservative growth rate is used that cannot exceed that of a company's Gross Domestic Product (GDP). In this case we used the 5-year average of the 10-year government bond yield (2.3%). The expected dividend per share is then discounted to today's value at a cost of equity of 9.0%. Relative to the current share price of HK$8.0, the company appears around fair value at the time of writing. The assumptions in any calculation have a big impact on the valuation, so it is better to view this as a rough estimate, not precise down to the last cent.
Value Per Share = Expected Dividend Per Share / (Discount Rate - Perpetual Growth Rate)
= CN¥0.5 / (9.0% – 2.3%)
= HK$7.6
Important Assumptions
We would point out that the most important inputs to a discounted cash flow are the discount rate and of course the actual cash flows. Part of investing is coming up with your own evaluation of a company's future performance, so try the calculation yourself and check your own assumptions. The DCF also does not consider the possible cyclicality of an industry, or a company's future capital requirements, so it does not give a full picture of a company's potential performance. Given that we are looking at Tianneng Power International as potential shareholders, the cost of equity is used as the discount rate, rather than the cost of capital (or weighted average cost of capital, WACC) which accounts for debt. In this calculation we've used 9.0%, which is based on a levered beta of 1.381. Beta is a measure of a stock's volatility, compared to the market as a whole. We get our beta from the industry average beta of globally comparable companies, with an imposed limit between 0.8 and 2.0, which is a reasonable range for a stable business.
SWOT Analysis for Tianneng Power International
- Debt is well covered by earnings.
- Balance sheet summary for 819.
- Earnings declined over the past year.
- Dividend is low compared to the top 25% of dividend payers in the Auto Components market.
- Annual earnings are forecast to grow faster than the Hong Kong market.
- Good value based on P/E ratio compared to estimated Fair P/E ratio.
- Debt is not well covered by operating cash flow.
- Paying a dividend but company has no free cash flows.
- Annual revenue is forecast to grow slower than the Hong Kong market.
- Is 819 well equipped to handle threats?
Moving On:
Whilst important, the DCF calculation ideally won't be the sole piece of analysis you scrutinize for a company. The DCF model is not a perfect stock valuation tool. Preferably you'd apply different cases and assumptions and see how they would impact the company's valuation. For example, changes in the company's cost of equity or the risk free rate can significantly impact the valuation. For Tianneng Power International, we've put together three relevant factors you should assess:
- Risks: Case in point, we've spotted 2 warning signs for Tianneng Power International you should be aware of, and 1 of them is a bit concerning.
- Future Earnings: How does 819's growth rate compare to its peers and the wider market? Dig deeper into the analyst consensus number for the upcoming years by interacting with our free analyst growth expectation chart.
- Other High Quality Alternatives: Do you like a good all-rounder? Explore our interactive list of high quality stocks to get an idea of what else is out there you may be missing!
PS. Simply Wall St updates its DCF calculation for every Hong Kong stock every day, so if you want to find the intrinsic value of any other stock just search here.
Valuation is complex, but we're here to simplify it.
Discover if Tianneng Power International might be undervalued or overvalued with our detailed analysis, featuring fair value estimates, potential risks, dividends, insider trades, and its financial condition.
Access Free AnalysisHave feedback on this article? Concerned about the content? Get in touch with us directly. Alternatively, email editorial-team (at) simplywallst.com.This article by Simply Wall St is general in nature. We provide commentary based on historical data and analyst forecasts only using an unbiased methodology and our articles are not intended to be financial advice. It does not constitute a recommendation to buy or sell any stock, and does not take account of your objectives, or your financial situation. We aim to bring you long-term focused analysis driven by fundamental data. Note that our analysis may not factor in the latest price-sensitive company announcements or qualitative material. Simply Wall St has no position in any stocks mentioned.
Disclaimer: Investing carries risk. This is not financial advice. The above content should not be regarded as an offer, recommendation, or solicitation on acquiring or disposing of any financial products, any associated discussions, comments, or posts by author or other users should not be considered as such either. It is solely for general information purpose only, which does not consider your own investment objectives, financial situations or needs. TTM assumes no responsibility or warranty for the accuracy and completeness of the information, investors should do their own research and may seek professional advice before investing.
Most Discussed
- 1
- 2
- 3
- 4
- 5
- 6
- 7
- 8
- 9
- 10