Solana (SOL) Price Drops Toward $190 Amid Rising Selling Pressure
- Solana struggles to hold above $200 as bearish indicators signal growing downside risks.
- The Ichimoku Cloud and DMI confirm seller dominance, with momentum favoring further declines.
- Key support at $187 could determine SOL’s next move, with risks extending toward $175 if broken.
Solana (SOL) price has struggled to maintain levels above $200, with its market cap now sitting at $94 billion. The latest price action shows that SOL faced strong resistance near $200 and has since declined to the $190 range in the last few days.
Technical indicators such as the Ichimoku Cloud and DMI suggest that sellers remain in control, with growing bearish momentum and weakening bullish attempts. As SOL approaches key support levels, the question now is whether it will stabilize and attempt a rebound or continue its decline toward lower price targets.
Solana Ichimoku Cloud Shows a Strong Bearish Setup
The Ichimoku Cloud chart for Solana currently displays bearish characteristics. Price action remains below the cloud, indicating persistent downward momentum.
The red cloud suggests that bearish sentiment has been dominant, and the attempted movement toward the cloud was quickly rejected, reinforcing the prevailing trend.
Additionally, the Tenkan-sen (blue line) is positioned beneath the Kijun-sen (red line), signaling ongoing weakness in the price structure. The downward slope of both lines further supports the notion that momentum favors the sellers rather than the buyers.
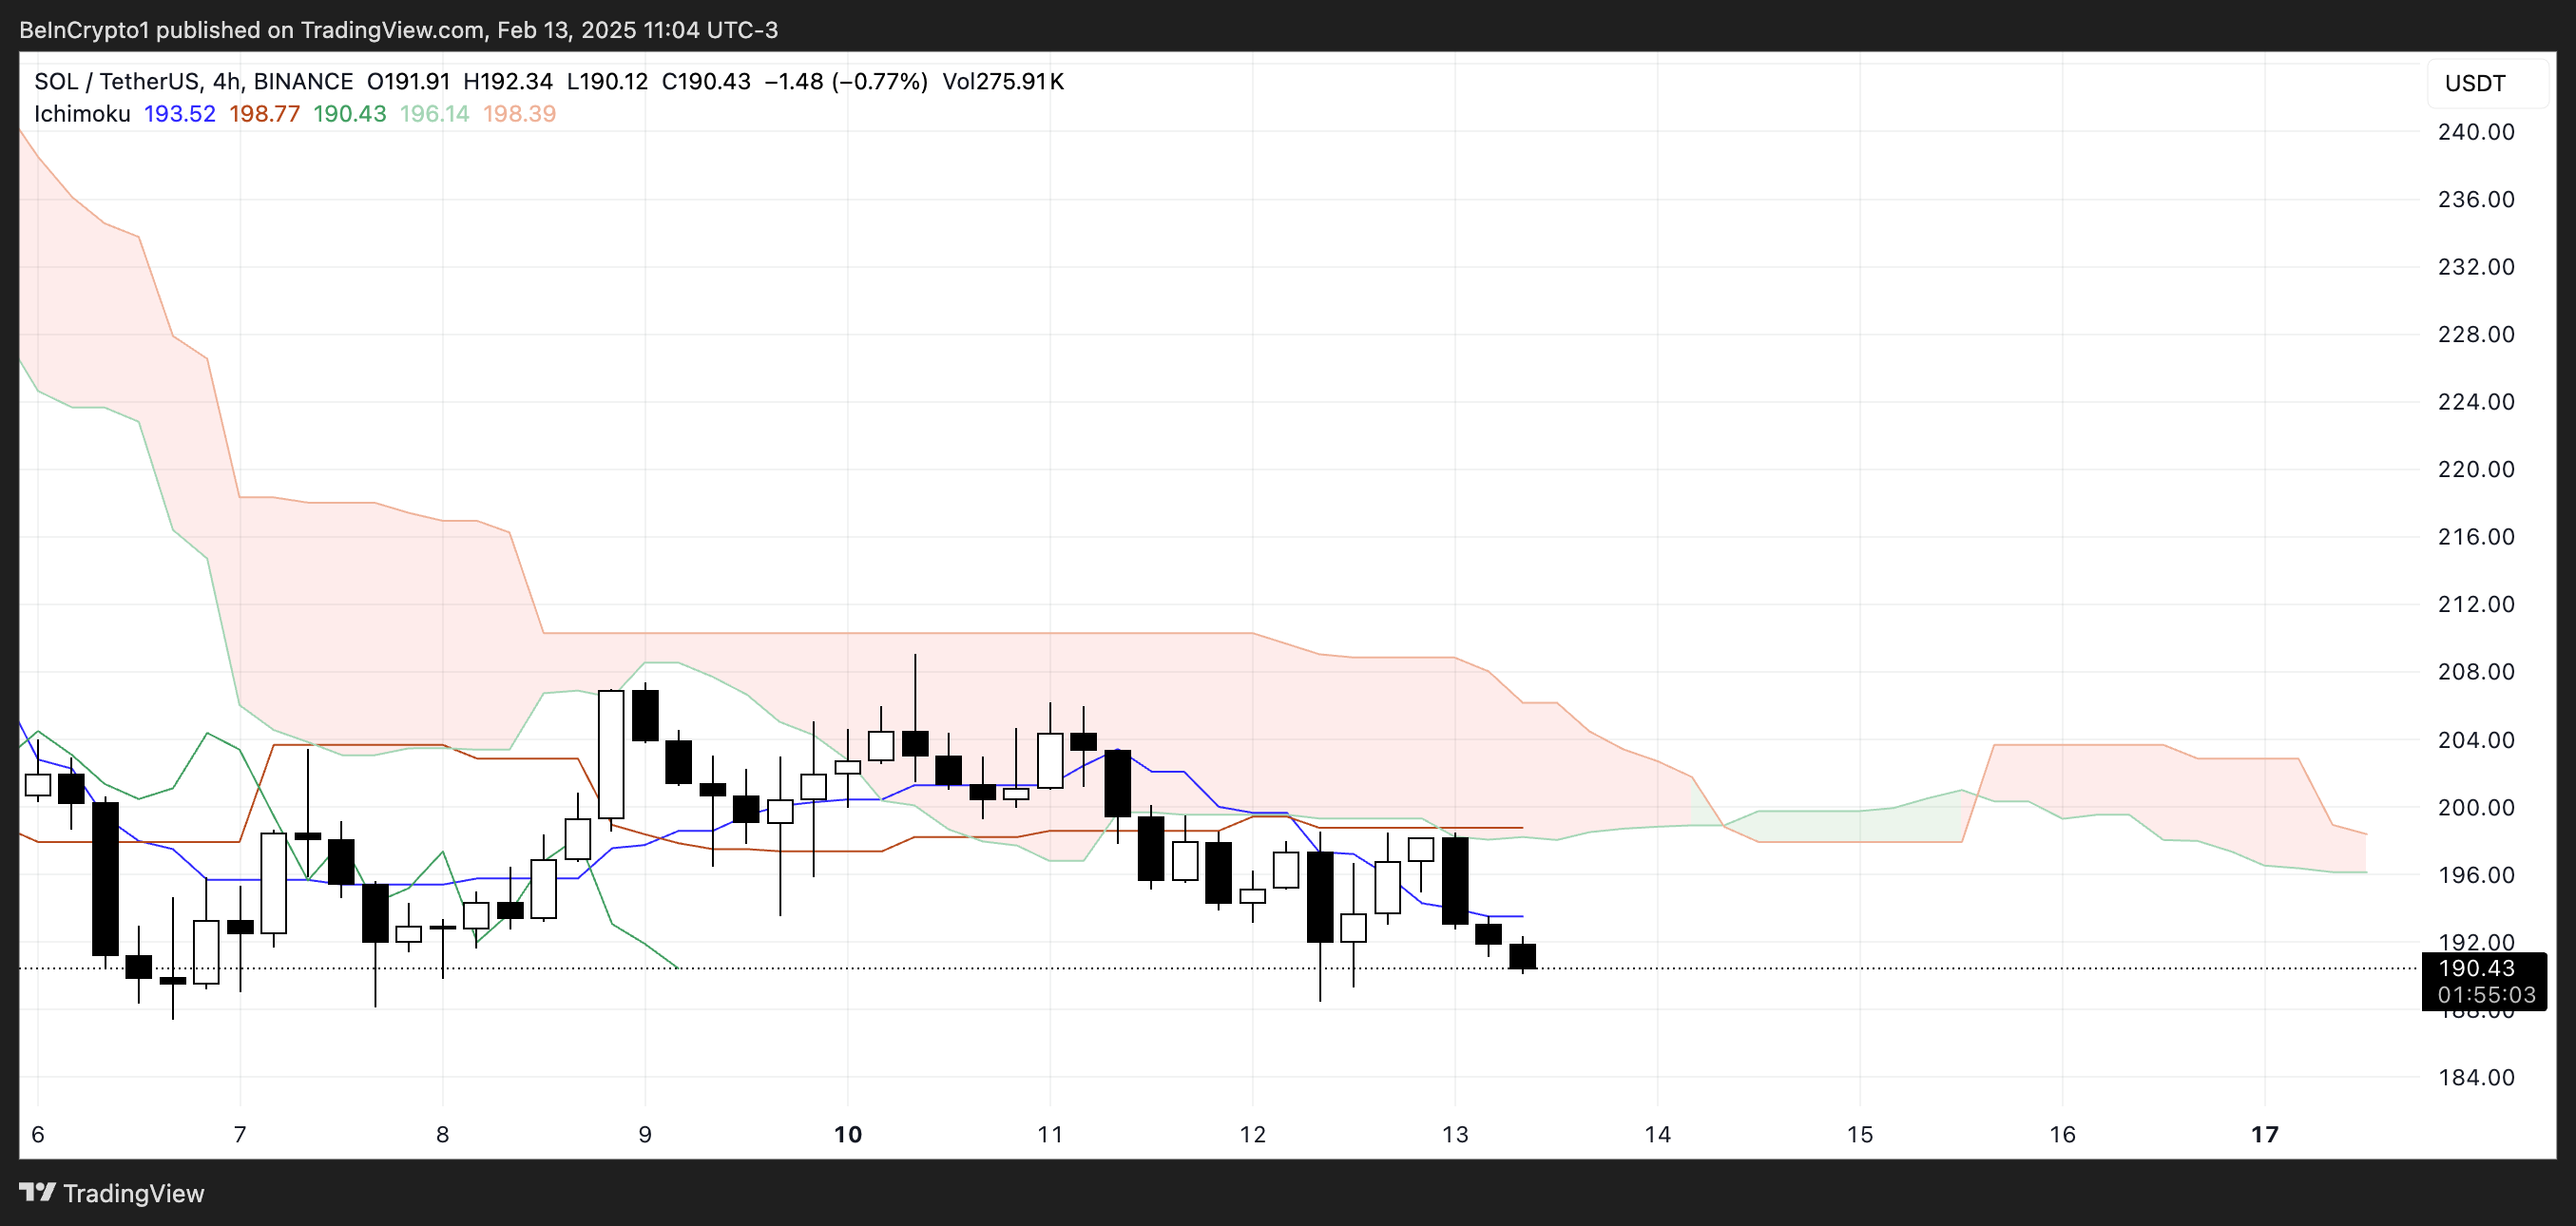
The projected portion of the cloud remains bearish, with the Senkou Span A (green line) below the Senkou Span B (red line), suggesting that downward pressure is likely to persist.
The Chikou Span (green lagging line) is also positioned below the past SOL price action, confirming that the market structure continues to favor a bearish outlook.
SOL DMI Shows the Downtrend Is Gaining Momentum
Solana DMI chart shows that its ADX is currently at 20.8, rising from 12.7 just two days ago. This increase suggests that trend strength is starting to build after a period of relatively low momentum.
While ADX alone does not indicate the direction of the trend, its upward movement signals that a more defined price movement is developing.
The shift from a weaker to a stronger trend suggests that recent market activity is becoming more directional, which could lead to a continuation of the prevailing trend.
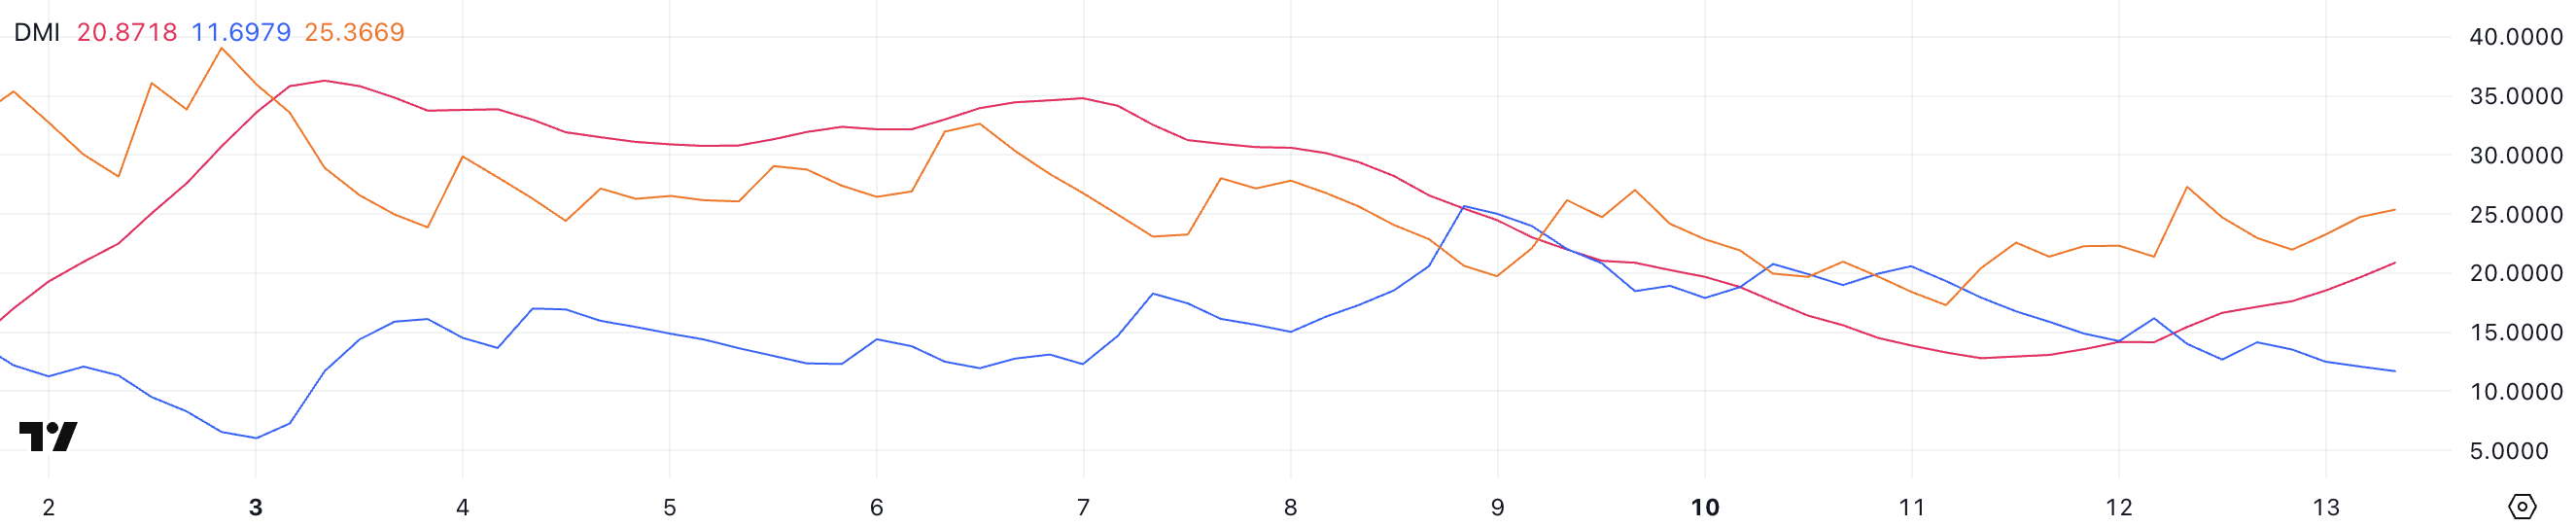
The ADX measures trend strength on a scale where values below 20 indicate a weak or indecisive market, while values above 25 suggest a strong and established trend. With ADX currently at 20.8 and rising, the market is approaching a level where price action becomes more directional.
Alongside this, the +DI has fallen from 17.9 to 11.6, while the -DI has increased from 20.4 to 25.3. This indicates that bearish momentum is strengthening as sellers take control.
Since the -DI is now significantly above the +DI and ADX is rising, Solana downtrend is gaining traction. If this trend continues and ADX surpasses 25, it would confirm a stronger bearish trend, making it more difficult for buyers to reverse the momentum in the near term.
SOL Price Prediction: Will SOL Return To $200 or Fall To $175?
Solana price recently failed to break above the $200 resistance and has since dropped to the $190 range. Its EMA lines remain positioned below the longer-term trend lines, reinforcing a broader bearish sentiment. This suggests that price action is still leaning towards the downside, with sellers maintaining control over momentum.
The inability to sustain levels above $200 indicates that buying pressure for SOL has not been strong enough to shift the market structure in favor of an uptrend, keeping the bearish outlook intact.
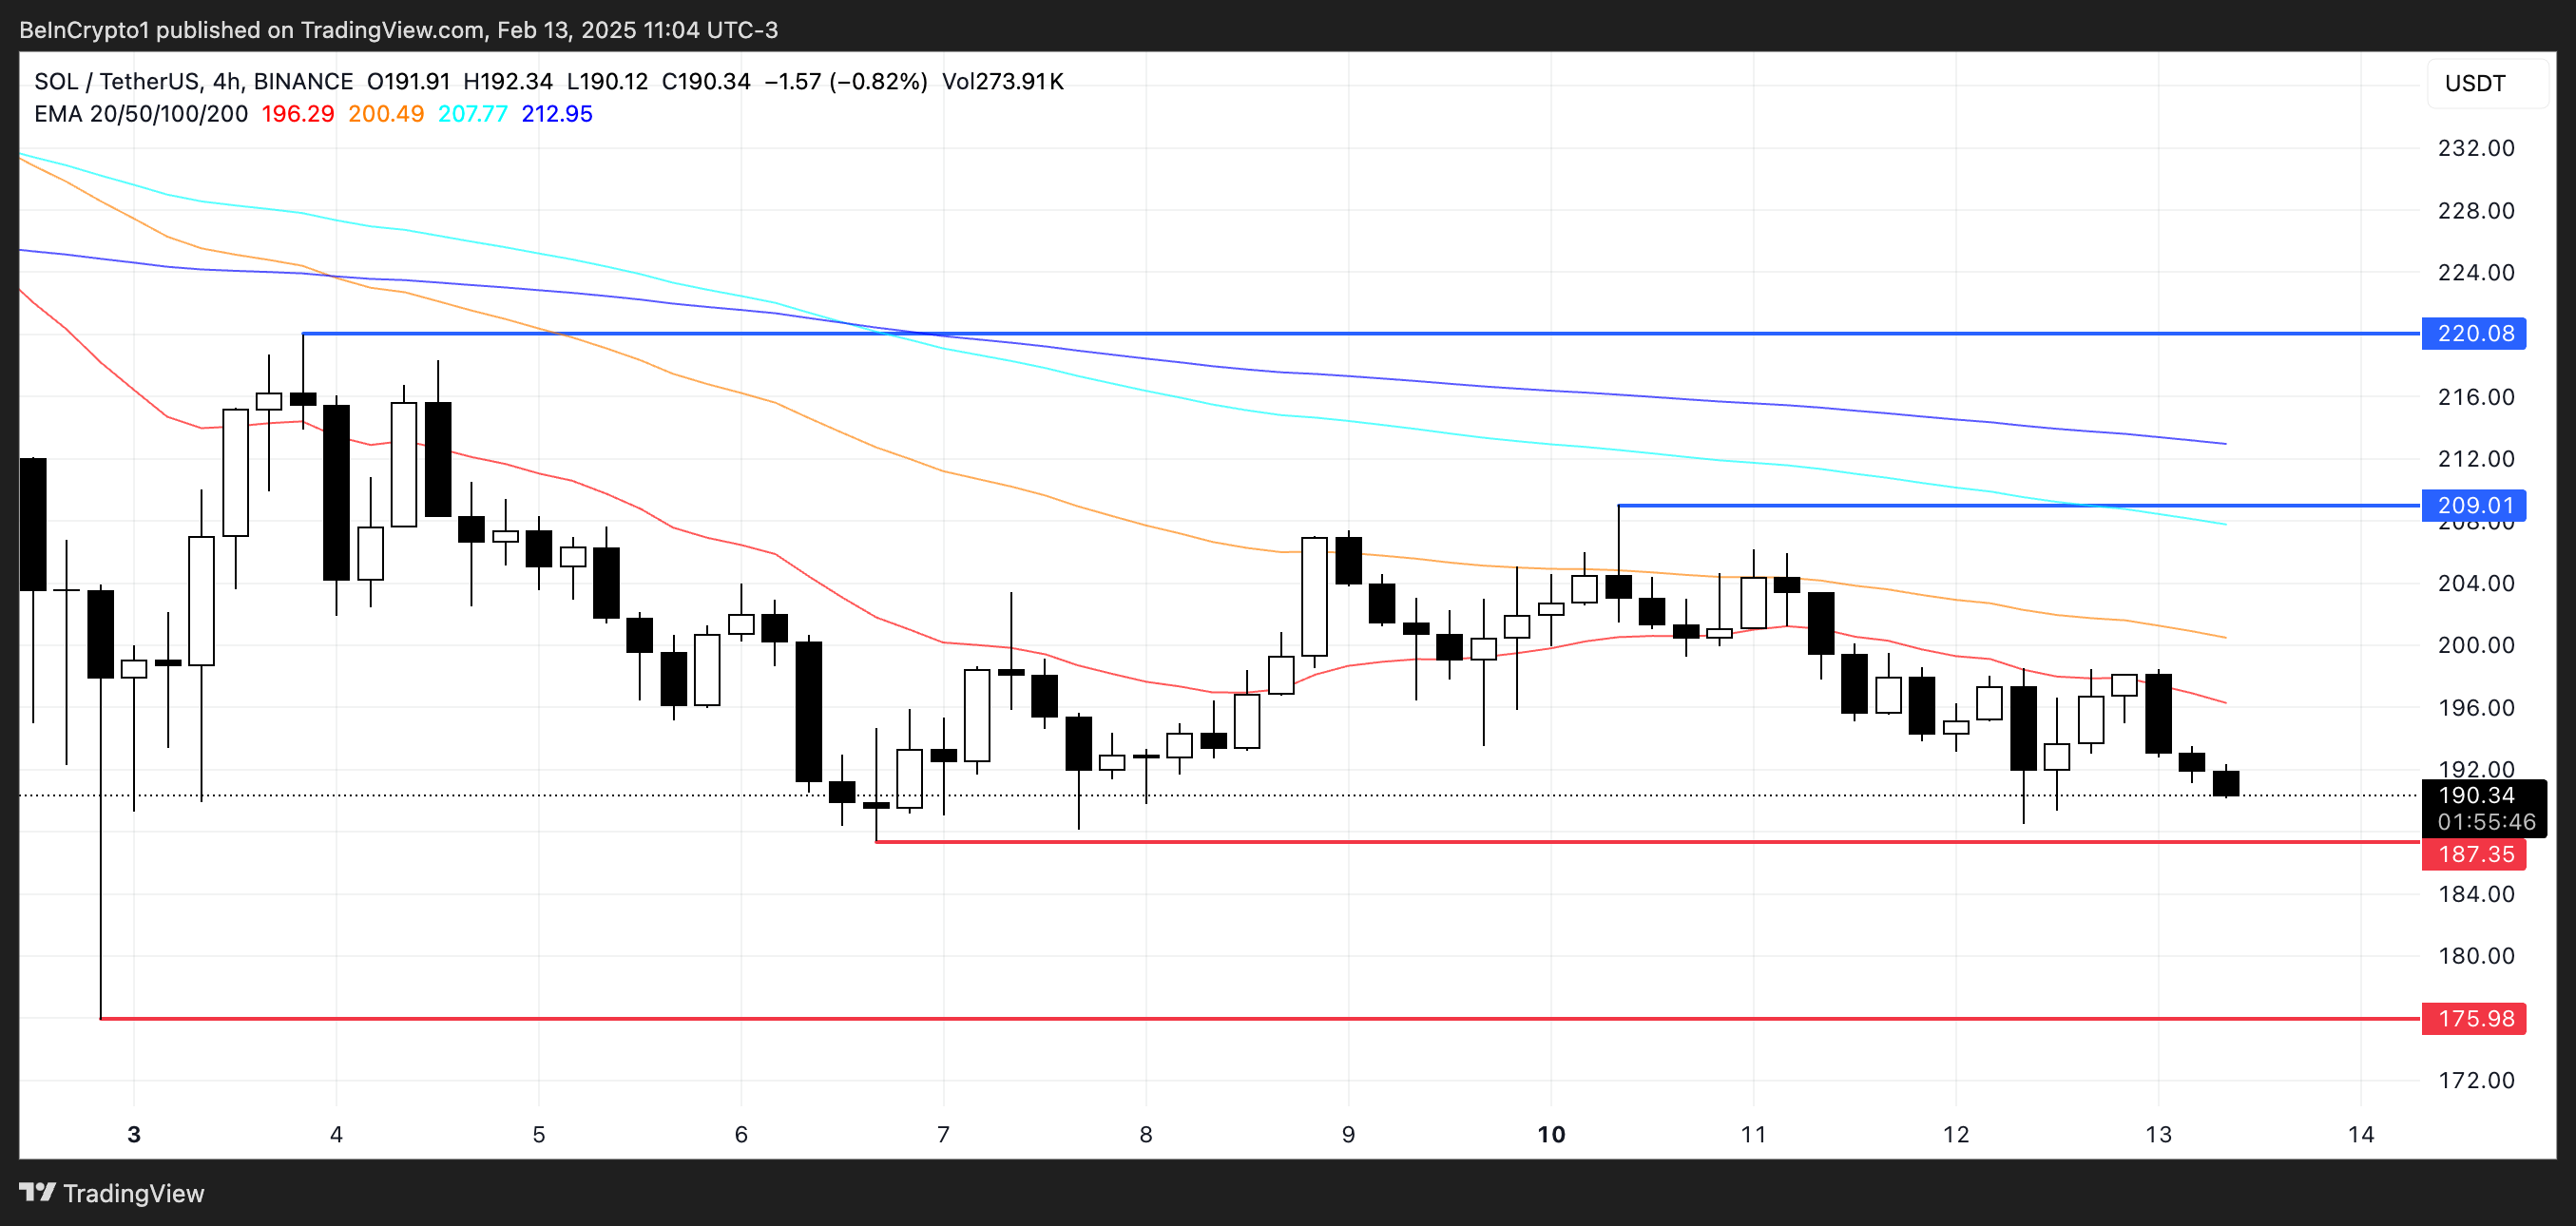
If this bearish trend persists, SOL could test the support at $187, a key level where buyers may attempt to step in. Losing this support could open the door for a continued decline toward $175, reinforcing the downtrend. However, if SOL can hold the $187 level and stabilize, a potential rebound could follow.
A sustained recovery and a breakout above $200 could shift sentiment, allowing SOL price to challenge the next resistance at $209. If bullish momentum strengthens further and clears that level, the next target would be $220, marking a significant shift in trend dynamics.
Disclaimer: Investing carries risk. This is not financial advice. The above content should not be regarded as an offer, recommendation, or solicitation on acquiring or disposing of any financial products, any associated discussions, comments, or posts by author or other users should not be considered as such either. It is solely for general information purpose only, which does not consider your own investment objectives, financial situations or needs. TTM assumes no responsibility or warranty for the accuracy and completeness of the information, investors should do their own research and may seek professional advice before investing.
Most Discussed
- 1
- 2
- 3
- 4
- 5
- 6
- 7
- 8
- 9
- 10