Calculating The Intrinsic Value Of Meilleure Health International Industry Group Limited (HKG:2327)
Key Insights
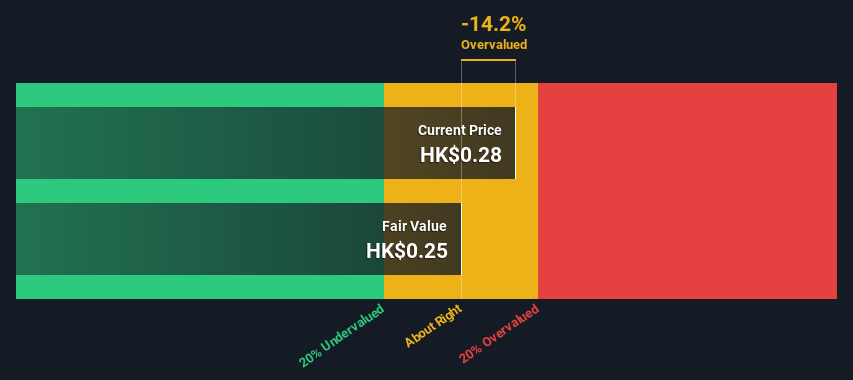
- The projected fair value for Meilleure Health International Industry Group is HK$0.25 based on 2 Stage Free Cash Flow to Equity
- Meilleure Health International Industry Group's HK$0.28 share price indicates it is trading at similar levels as its fair value estimate
- Meilleure Health International Industry Group's peers seem to be trading at a higher premium to fair value based onthe industry average of -148%
In this article we are going to estimate the intrinsic value of Meilleure Health International Industry Group Limited (HKG:2327) by taking the expected future cash flows and discounting them to their present value. We will use the Discounted Cash Flow (DCF) model on this occasion. Believe it or not, it's not too difficult to follow, as you'll see from our example!
Remember though, that there are many ways to estimate a company's value, and a DCF is just one method. If you still have some burning questions about this type of valuation, take a look at the Simply Wall St analysis model.
Check out our latest analysis for Meilleure Health International Industry Group
Is Meilleure Health International Industry Group Fairly Valued?
We're using the 2-stage growth model, which simply means we take in account two stages of company's growth. In the initial period the company may have a higher growth rate and the second stage is usually assumed to have a stable growth rate. To start off with, we need to estimate the next ten years of cash flows. Seeing as no analyst estimates of free cash flow are available to us, we have extrapolate the previous free cash flow (FCF) from the company's last reported value. We assume companies with shrinking free cash flow will slow their rate of shrinkage, and that companies with growing free cash flow will see their growth rate slow, over this period. We do this to reflect that growth tends to slow more in the early years than it does in later years.
Generally we assume that a dollar today is more valuable than a dollar in the future, so we need to discount the sum of these future cash flows to arrive at a present value estimate:
10-year free cash flow (FCF) forecast
| 2025 | 2026 | 2027 | 2028 | 2029 | 2030 | 2031 | 2032 | 2033 | 2034 | |
| Levered FCF (HK$, Millions) | HK$57.2m | HK$59.8m | HK$62.0m | HK$64.1m | HK$66.1m | HK$68.1m | HK$70.0m | HK$71.8m | HK$73.7m | HK$75.6m |
| Growth Rate Estimate Source | Est @ 5.25% | Est @ 4.40% | Est @ 3.81% | Est @ 3.40% | Est @ 3.11% | Est @ 2.91% | Est @ 2.77% | Est @ 2.67% | Est @ 2.60% | Est @ 2.55% |
| Present Value (HK$, Millions) Discounted @ 8.4% | HK$52.8 | HK$50.9 | HK$48.7 | HK$46.5 | HK$44.2 | HK$42.0 | HK$39.8 | HK$37.7 | HK$35.7 | HK$33.8 |
("Est" = FCF growth rate estimated by Simply Wall St)Present Value of 10-year Cash Flow (PVCF) = HK$432m
After calculating the present value of future cash flows in the initial 10-year period, we need to calculate the Terminal Value, which accounts for all future cash flows beyond the first stage. For a number of reasons a very conservative growth rate is used that cannot exceed that of a country's GDP growth. In this case we have used the 5-year average of the 10-year government bond yield (2.4%) to estimate future growth. In the same way as with the 10-year 'growth' period, we discount future cash flows to today's value, using a cost of equity of 8.4%.
Terminal Value (TV)= FCF2034 × (1 + g) ÷ (r – g) = HK$76m× (1 + 2.4%) ÷ (8.4%– 2.4%) = HK$1.3b
Present Value of Terminal Value (PVTV)= TV / (1 + r)10= HK$1.3b÷ ( 1 + 8.4%)10= HK$582m
The total value, or equity value, is then the sum of the present value of the future cash flows, which in this case is HK$1.0b. To get the intrinsic value per share, we divide this by the total number of shares outstanding. Compared to the current share price of HK$0.3, the company appears around fair value at the time of writing. The assumptions in any calculation have a big impact on the valuation, so it is better to view this as a rough estimate, not precise down to the last cent.
The Assumptions
We would point out that the most important inputs to a discounted cash flow are the discount rate and of course the actual cash flows. Part of investing is coming up with your own evaluation of a company's future performance, so try the calculation yourself and check your own assumptions. The DCF also does not consider the possible cyclicality of an industry, or a company's future capital requirements, so it does not give a full picture of a company's potential performance. Given that we are looking at Meilleure Health International Industry Group as potential shareholders, the cost of equity is used as the discount rate, rather than the cost of capital (or weighted average cost of capital, WACC) which accounts for debt. In this calculation we've used 8.4%, which is based on a levered beta of 1.159. Beta is a measure of a stock's volatility, compared to the market as a whole. We get our beta from the industry average beta of globally comparable companies, with an imposed limit between 0.8 and 2.0, which is a reasonable range for a stable business.
SWOT Analysis for Meilleure Health International Industry Group
- Earnings growth over the past year exceeded the industry.
- Debt is well covered by earnings.
- Balance sheet summary for 2327.
- Dividend is low compared to the top 25% of dividend payers in the Trade Distributors market.
- Current share price is above our estimate of fair value.
- Significant insider buying over the past 3 months.
- Lack of analyst coverage makes it difficult to determine 2327's earnings prospects.
- Debt is not well covered by operating cash flow.
- Is 2327 well equipped to handle threats?
Moving On:
Although the valuation of a company is important, it ideally won't be the sole piece of analysis you scrutinize for a company. DCF models are not the be-all and end-all of investment valuation. Preferably you'd apply different cases and assumptions and see how they would impact the company's valuation. If a company grows at a different rate, or if its cost of equity or risk free rate changes sharply, the output can look very different. For Meilleure Health International Industry Group, we've compiled three important aspects you should explore:
- Risks: Consider for instance, the ever-present spectre of investment risk. We've identified 1 warning sign with Meilleure Health International Industry Group , and understanding this should be part of your investment process.
- Management:Have insiders been ramping up their shares to take advantage of the market's sentiment for 2327's future outlook? Check out our management and board analysis with insights on CEO compensation and governance factors.
- Other High Quality Alternatives: Do you like a good all-rounder? Explore our interactive list of high quality stocks to get an idea of what else is out there you may be missing!
PS. Simply Wall St updates its DCF calculation for every Hong Kong stock every day, so if you want to find the intrinsic value of any other stock just search here.
New: Manage All Your Stock Portfolios in One Place
We've created the ultimate portfolio companion for stock investors, and it's free.
• Connect an unlimited number of Portfolios and see your total in one currency• Be alerted to new Warning Signs or Risks via email or mobile• Track the Fair Value of your stocks
Try a Demo Portfolio for FreeHave feedback on this article? Concerned about the content? Get in touch with us directly. Alternatively, email editorial-team (at) simplywallst.com.This article by Simply Wall St is general in nature. We provide commentary based on historical data and analyst forecasts only using an unbiased methodology and our articles are not intended to be financial advice. It does not constitute a recommendation to buy or sell any stock, and does not take account of your objectives, or your financial situation. We aim to bring you long-term focused analysis driven by fundamental data. Note that our analysis may not factor in the latest price-sensitive company announcements or qualitative material. Simply Wall St has no position in any stocks mentioned.
Disclaimer: Investing carries risk. This is not financial advice. The above content should not be regarded as an offer, recommendation, or solicitation on acquiring or disposing of any financial products, any associated discussions, comments, or posts by author or other users should not be considered as such either. It is solely for general information purpose only, which does not consider your own investment objectives, financial situations or needs. TTM assumes no responsibility or warranty for the accuracy and completeness of the information, investors should do their own research and may seek professional advice before investing.
Most Discussed
- 1
- 2
- 3
- 4
- 5
- 6
- 7
- 8
- 9
- 10