What You Can Learn From SBS Transit Ltd's (SGX:S61) P/E
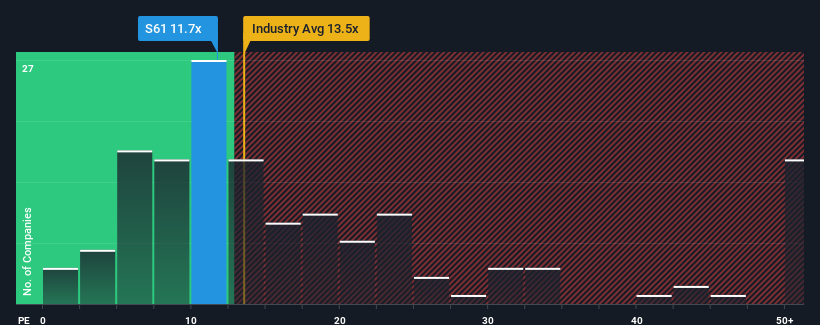
It's not a stretch to say that SBS Transit Ltd's (SGX:S61) price-to-earnings (or "P/E") ratio of 11.7x right now seems quite "middle-of-the-road" compared to the market in Singapore, where the median P/E ratio is around 12x. Although, it's not wise to simply ignore the P/E without explanation as investors may be disregarding a distinct opportunity or a costly mistake.
It looks like earnings growth has deserted SBS Transit recently, which is not something to boast about. One possibility is that the P/E is moderate because investors think this benign earnings growth rate might not be enough to outperform the broader market in the near future. If you like the company, you'd be hoping this isn't the case so that you could potentially pick up some stock while it's not quite in favour.
View our latest analysis for SBS Transit
Is There Some Growth For SBS Transit?
There's an inherent assumption that a company should be matching the market for P/E ratios like SBS Transit's to be considered reasonable.
If we review the last year of earnings, the company posted a result that saw barely any deviation from a year ago. However, a few strong years before that means that it was still able to grow EPS by an impressive 36% in total over the last three years. So we can start by confirming that the company has done a great job of growing earnings over that time.
It's interesting to note that the rest of the market is similarly expected to grow by 11% over the next year, which is fairly even with the company's recent medium-term annualised growth rates.
With this information, we can see why SBS Transit is trading at a fairly similar P/E to the market. It seems most investors are expecting to see average growth rates continue into the future and are only willing to pay a moderate amount for the stock.
The Key Takeaway
Typically, we'd caution against reading too much into price-to-earnings ratios when settling on investment decisions, though it can reveal plenty about what other market participants think about the company.
As we suspected, our examination of SBS Transit revealed its three-year earnings trends are contributing to its P/E, given they look similar to current market expectations. At this stage investors feel the potential for an improvement or deterioration in earnings isn't great enough to justify a high or low P/E ratio. If recent medium-term earnings trends continue, it's hard to see the share price moving strongly in either direction in the near future under these circumstances.
Having said that, be aware SBS Transit is showing 2 warning signs in our investment analysis, and 1 of those is a bit unpleasant.
Of course, you might find a fantastic investment by looking at a few good candidates. So take a peek at this free list of companies with a strong growth track record, trading on a low P/E.
New: Manage All Your Stock Portfolios in One Place
We've created the ultimate portfolio companion for stock investors, and it's free.
• Connect an unlimited number of Portfolios and see your total in one currency• Be alerted to new Warning Signs or Risks via email or mobile• Track the Fair Value of your stocks
Try a Demo Portfolio for FreeHave feedback on this article? Concerned about the content? Get in touch with us directly. Alternatively, email editorial-team (at) simplywallst.com.This article by Simply Wall St is general in nature. We provide commentary based on historical data and analyst forecasts only using an unbiased methodology and our articles are not intended to be financial advice. It does not constitute a recommendation to buy or sell any stock, and does not take account of your objectives, or your financial situation. We aim to bring you long-term focused analysis driven by fundamental data. Note that our analysis may not factor in the latest price-sensitive company announcements or qualitative material. Simply Wall St has no position in any stocks mentioned.
Disclaimer: Investing carries risk. This is not financial advice. The above content should not be regarded as an offer, recommendation, or solicitation on acquiring or disposing of any financial products, any associated discussions, comments, or posts by author or other users should not be considered as such either. It is solely for general information purpose only, which does not consider your own investment objectives, financial situations or needs. TTM assumes no responsibility or warranty for the accuracy and completeness of the information, investors should do their own research and may seek professional advice before investing.
Most Discussed
- 1
- 2
- 3
- 4
- 5
- 6
- 7
- 8
- 9
- 10