Unpleasant Surprises Could Be In Store For IPG Photonics Corporation's (NASDAQ:IPGP) Shares
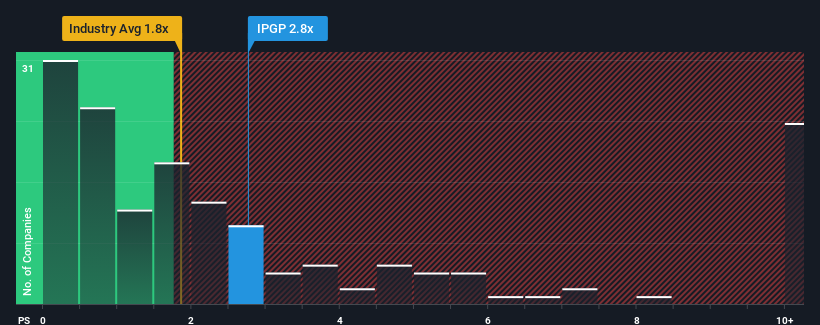
When close to half the companies in the Electronic industry in the United States have price-to-sales ratios (or "P/S") below 1.8x, you may consider IPG Photonics Corporation (NASDAQ:IPGP) as a stock to potentially avoid with its 2.8x P/S ratio. Nonetheless, we'd need to dig a little deeper to determine if there is a rational basis for the elevated P/S.
View our latest analysis for IPG Photonics
How IPG Photonics Has Been Performing
IPG Photonics could be doing better as its revenue has been going backwards lately while most other companies have been seeing positive revenue growth. One possibility is that the P/S ratio is high because investors think this poor revenue performance will turn the corner. However, if this isn't the case, investors might get caught out paying too much for the stock.
If you'd like to see what analysts are forecasting going forward, you should check out our free report on IPG Photonics.Do Revenue Forecasts Match The High P/S Ratio?
In order to justify its P/S ratio, IPG Photonics would need to produce impressive growth in excess of the industry.
Retrospectively, the last year delivered a frustrating 24% decrease to the company's top line. The last three years don't look nice either as the company has shrunk revenue by 33% in aggregate. So unfortunately, we have to acknowledge that the company has not done a great job of growing revenue over that time.
Looking ahead now, revenue is anticipated to climb by 3.5% per year during the coming three years according to the ten analysts following the company. With the industry predicted to deliver 9.3% growth per annum, the company is positioned for a weaker revenue result.
In light of this, it's alarming that IPG Photonics' P/S sits above the majority of other companies. It seems most investors are hoping for a turnaround in the company's business prospects, but the analyst cohort is not so confident this will happen. There's a good chance these shareholders are setting themselves up for future disappointment if the P/S falls to levels more in line with the growth outlook.
What We Can Learn From IPG Photonics' P/S?
It's argued the price-to-sales ratio is an inferior measure of value within certain industries, but it can be a powerful business sentiment indicator.
It comes as a surprise to see IPG Photonics trade at such a high P/S given the revenue forecasts look less than stellar. The weakness in the company's revenue estimate doesn't bode well for the elevated P/S, which could take a fall if the revenue sentiment doesn't improve. At these price levels, investors should remain cautious, particularly if things don't improve.
A lot of potential risks can sit within a company's balance sheet. Our free balance sheet analysis for IPG Photonics with six simple checks will allow you to discover any risks that could be an issue.
Of course, profitable companies with a history of great earnings growth are generally safer bets. So you may wish to see this free collection of other companies that have reasonable P/E ratios and have grown earnings strongly.
New: AI Stock Screener & Alerts
Our new AI Stock Screener scans the market every day to uncover opportunities.
• Dividend Powerhouses (3%+ Yield)• Undervalued Small Caps with Insider Buying• High growth Tech and AI CompaniesOr build your own from over 50 metrics.
Explore Now for FreeHave feedback on this article? Concerned about the content? Get in touch with us directly. Alternatively, email editorial-team (at) simplywallst.com.This article by Simply Wall St is general in nature. We provide commentary based on historical data and analyst forecasts only using an unbiased methodology and our articles are not intended to be financial advice. It does not constitute a recommendation to buy or sell any stock, and does not take account of your objectives, or your financial situation. We aim to bring you long-term focused analysis driven by fundamental data. Note that our analysis may not factor in the latest price-sensitive company announcements or qualitative material. Simply Wall St has no position in any stocks mentioned.
Disclaimer: Investing carries risk. This is not financial advice. The above content should not be regarded as an offer, recommendation, or solicitation on acquiring or disposing of any financial products, any associated discussions, comments, or posts by author or other users should not be considered as such either. It is solely for general information purpose only, which does not consider your own investment objectives, financial situations or needs. TTM assumes no responsibility or warranty for the accuracy and completeness of the information, investors should do their own research and may seek professional advice before investing.
Most Discussed
- 1
- 2
- 3
- 4
- 5
- 6
- 7
- 8
- 9
- 10