Why We're Not Concerned Yet About SPS Commerce, Inc.'s (NASDAQ:SPSC) 27% Share Price Plunge
The SPS Commerce, Inc. (NASDAQ:SPSC) share price has fared very poorly over the last month, falling by a substantial 27%. The drop over the last 30 days has capped off a tough year for shareholders, with the share price down 28% in that time.
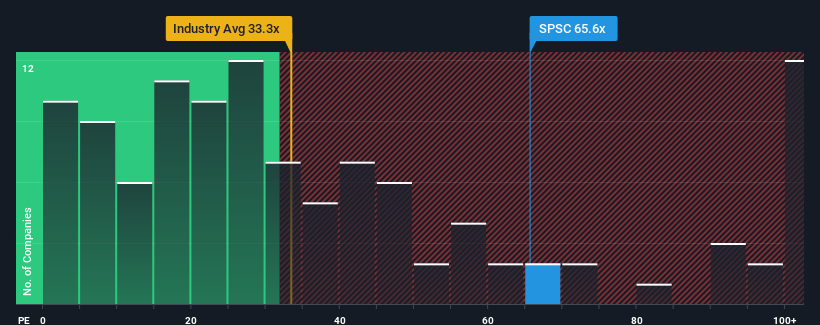
Even after such a large drop in price, SPS Commerce may still be sending very bearish signals at the moment with a price-to-earnings (or "P/E") ratio of 65.6x, since almost half of all companies in the United States have P/E ratios under 17x and even P/E's lower than 10x are not unusual. However, the P/E might be quite high for a reason and it requires further investigation to determine if it's justified.
Recent times have been advantageous for SPS Commerce as its earnings have been rising faster than most other companies. The P/E is probably high because investors think this strong earnings performance will continue. If not, then existing shareholders might be a little nervous about the viability of the share price.
View our latest analysis for SPS Commerce
Is There Enough Growth For SPS Commerce?
The only time you'd be truly comfortable seeing a P/E as steep as SPS Commerce's is when the company's growth is on track to outshine the market decidedly.
Retrospectively, the last year delivered a decent 15% gain to the company's bottom line. The latest three year period has also seen an excellent 63% overall rise in EPS, aided somewhat by its short-term performance. Therefore, it's fair to say the earnings growth recently has been superb for the company.
Turning to the outlook, the next three years should generate growth of 16% each year as estimated by the eleven analysts watching the company. With the market only predicted to deliver 11% per year, the company is positioned for a stronger earnings result.
With this information, we can see why SPS Commerce is trading at such a high P/E compared to the market. Apparently shareholders aren't keen to offload something that is potentially eyeing a more prosperous future.
The Final Word
Even after such a strong price drop, SPS Commerce's P/E still exceeds the rest of the market significantly. It's argued the price-to-earnings ratio is an inferior measure of value within certain industries, but it can be a powerful business sentiment indicator.
As we suspected, our examination of SPS Commerce's analyst forecasts revealed that its superior earnings outlook is contributing to its high P/E. At this stage investors feel the potential for a deterioration in earnings isn't great enough to justify a lower P/E ratio. Unless these conditions change, they will continue to provide strong support to the share price.
A lot of potential risks can sit within a company's balance sheet. Our free balance sheet analysis for SPS Commerce with six simple checks will allow you to discover any risks that could be an issue.
You might be able to find a better investment than SPS Commerce. If you want a selection of possible candidates, check out this free list of interesting companies that trade on a low P/E (but have proven they can grow earnings).
If you're looking to trade SPS Commerce, open an account with the lowest-cost platform trusted by professionals, Interactive Brokers.
With clients in over 200 countries and territories, and access to 160 markets, IBKR lets you trade stocks, options, futures, forex, bonds and funds from a single integrated account.
Enjoy no hidden fees, no account minimums, and FX conversion rates as low as 0.03%, far better than what most brokers offer.
Sponsored ContentNew: Manage All Your Stock Portfolios in One Place
We've created the ultimate portfolio companion for stock investors, and it's free.
• Connect an unlimited number of Portfolios and see your total in one currency• Be alerted to new Warning Signs or Risks via email or mobile• Track the Fair Value of your stocks
Try a Demo Portfolio for FreeHave feedback on this article? Concerned about the content? Get in touch with us directly. Alternatively, email editorial-team (at) simplywallst.com.This article by Simply Wall St is general in nature. We provide commentary based on historical data and analyst forecasts only using an unbiased methodology and our articles are not intended to be financial advice. It does not constitute a recommendation to buy or sell any stock, and does not take account of your objectives, or your financial situation. We aim to bring you long-term focused analysis driven by fundamental data. Note that our analysis may not factor in the latest price-sensitive company announcements or qualitative material. Simply Wall St has no position in any stocks mentioned.
Disclaimer: Investing carries risk. This is not financial advice. The above content should not be regarded as an offer, recommendation, or solicitation on acquiring or disposing of any financial products, any associated discussions, comments, or posts by author or other users should not be considered as such either. It is solely for general information purpose only, which does not consider your own investment objectives, financial situations or needs. TTM assumes no responsibility or warranty for the accuracy and completeness of the information, investors should do their own research and may seek professional advice before investing.
Most Discussed

No relevant data is available