NI Holdings Full Year 2024 Earnings: EPS: US$0.32 (vs US$0.93 in FY 2023)
NI Holdings (NASDAQ:NODK) Full Year 2024 Results
Key Financial Results
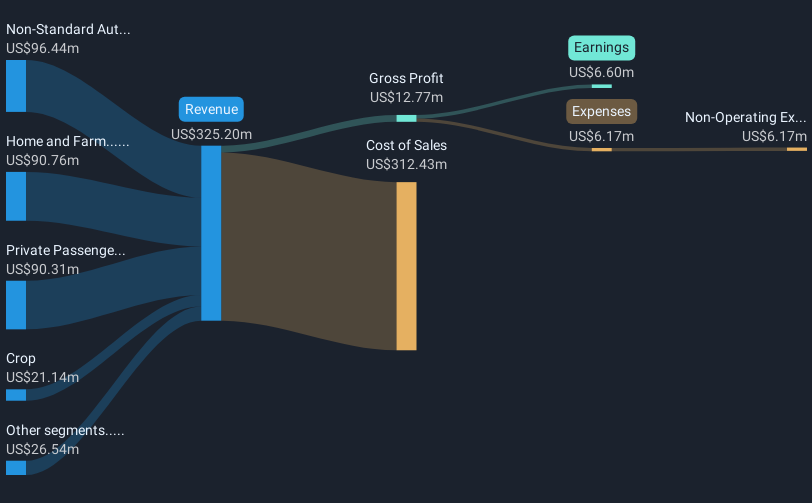
- Revenue: US$325.2m (up 7.0% from FY 2023).
- Net income: US$6.60m (down 66% from FY 2023).
- Profit margin: 2.0% (down from 6.4% in FY 2023).
- EPS: US$0.32 (down from US$0.93 in FY 2023).
NODK Profitability Indicators
- Combined ratio: 100.7% (up from 97.0% in FY 2023).
All figures shown in the chart above are for the trailing 12 month (TTM) period
The primary driver behind last 12 months revenue was the Non-Standard Auto segment contributing a total revenue of US$96.4m (30% of total revenue). Notably, cost of sales worth US$312.4m amounted to 96% of total revenue thereby underscoring the impact on earnings. The most substantial expense, totaling US$6.17m were related to Non-Operating costs. This indicates that a significant portion of the company's costs is related to non-core activities. Explore how NODK's revenue and expenses shape its earnings.
NI Holdings shares are up 4.9% from a week ago.
Risk Analysis
Be aware that NI Holdings is showing 3 warning signs in our investment analysis and 1 of those can't be ignored...
Valuation is complex, but we're here to simplify it.
Discover if NI Holdings might be undervalued or overvalued with our detailed analysis, featuring fair value estimates, potential risks, dividends, insider trades, and its financial condition.
Access Free AnalysisHave feedback on this article? Concerned about the content? Get in touch with us directly. Alternatively, email editorial-team (at) simplywallst.com.This article by Simply Wall St is general in nature. We provide commentary based on historical data and analyst forecasts only using an unbiased methodology and our articles are not intended to be financial advice. It does not constitute a recommendation to buy or sell any stock, and does not take account of your objectives, or your financial situation. We aim to bring you long-term focused analysis driven by fundamental data. Note that our analysis may not factor in the latest price-sensitive company announcements or qualitative material. Simply Wall St has no position in any stocks mentioned.
Disclaimer: Investing carries risk. This is not financial advice. The above content should not be regarded as an offer, recommendation, or solicitation on acquiring or disposing of any financial products, any associated discussions, comments, or posts by author or other users should not be considered as such either. It is solely for general information purpose only, which does not consider your own investment objectives, financial situations or needs. TTM assumes no responsibility or warranty for the accuracy and completeness of the information, investors should do their own research and may seek professional advice before investing.
Most Discussed
- 1
- 2
- 3
- 4
- 5
- 6
- 7
- 8
- 9
- 10