We Think OptimizeRx (NASDAQ:OPRX) Has A Fair Chunk Of Debt
David Iben put it well when he said, 'Volatility is not a risk we care about. What we care about is avoiding the permanent loss of capital.' When we think about how risky a company is, we always like to look at its use of debt, since debt overload can lead to ruin. Importantly, OptimizeRx Corporation (NASDAQ:OPRX) does carry debt. But is this debt a concern to shareholders?
Why Does Debt Bring Risk?
Debt and other liabilities become risky for a business when it cannot easily fulfill those obligations, either with free cash flow or by raising capital at an attractive price. Ultimately, if the company can't fulfill its legal obligations to repay debt, shareholders could walk away with nothing. However, a more frequent (but still costly) occurrence is where a company must issue shares at bargain-basement prices, permanently diluting shareholders, just to shore up its balance sheet. By replacing dilution, though, debt can be an extremely good tool for businesses that need capital to invest in growth at high rates of return. When we think about a company's use of debt, we first look at cash and debt together.
View our latest analysis for OptimizeRx
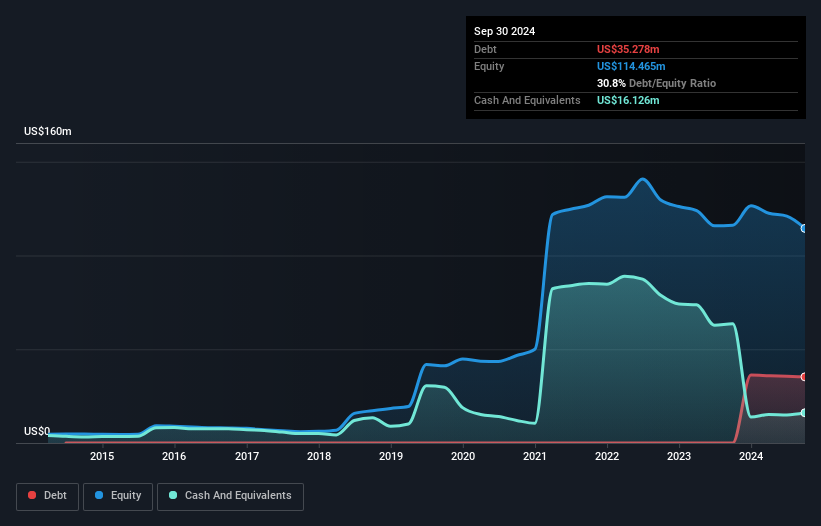
What Is OptimizeRx's Debt?
You can click the graphic below for the historical numbers, but it shows that as of September 2024 OptimizeRx had US$35.3m of debt, an increase on none, over one year. However, it also had US$16.1m in cash, and so its net debt is US$19.2m.
A Look At OptimizeRx's Liabilities
The latest balance sheet data shows that OptimizeRx had liabilities of US$14.5m due within a year, and liabilities of US$36.2m falling due after that. Offsetting these obligations, it had cash of US$16.1m as well as receivables valued at US$26.4m due within 12 months. So it has liabilities totalling US$8.22m more than its cash and near-term receivables, combined.
Since publicly traded OptimizeRx shares are worth a total of US$86.9m, it seems unlikely that this level of liabilities would be a major threat. But there are sufficient liabilities that we would certainly recommend shareholders continue to monitor the balance sheet, going forward. There's no doubt that we learn most about debt from the balance sheet. But it is future earnings, more than anything, that will determine OptimizeRx's ability to maintain a healthy balance sheet going forward. So if you want to see what the professionals think, you might find this free report on analyst profit forecasts to be interesting.
In the last year OptimizeRx wasn't profitable at an EBIT level, but managed to grow its revenue by 40%, to US$88m. With any luck the company will be able to grow its way to profitability.
Caveat Emptor
Even though OptimizeRx managed to grow its top line quite deftly, the cold hard truth is that it is losing money on the EBIT line. Indeed, it lost US$7.6m at the EBIT level. When we look at that and recall the liabilities on its balance sheet, relative to cash, it seems unwise to us for the company to have any debt. Quite frankly we think the balance sheet is far from match-fit, although it could be improved with time. Another cause for caution is that is bled US$1.1m in negative free cash flow over the last twelve months. So suffice it to say we do consider the stock to be risky. When analysing debt levels, the balance sheet is the obvious place to start. However, not all investment risk resides within the balance sheet - far from it. Case in point: We've spotted 2 warning signs for OptimizeRx you should be aware of.
At the end of the day, it's often better to focus on companies that are free from net debt. You can access our special list of such companies (all with a track record of profit growth). It's free.
If you're looking to trade OptimizeRx, open an account with the lowest-cost platform trusted by professionals, Interactive Brokers.
With clients in over 200 countries and territories, and access to 160 markets, IBKR lets you trade stocks, options, futures, forex, bonds and funds from a single integrated account.
Enjoy no hidden fees, no account minimums, and FX conversion rates as low as 0.03%, far better than what most brokers offer.
Sponsored ContentNew: AI Stock Screener & Alerts
Our new AI Stock Screener scans the market every day to uncover opportunities.
• Dividend Powerhouses (3%+ Yield)• Undervalued Small Caps with Insider Buying• High growth Tech and AI CompaniesOr build your own from over 50 metrics.
Explore Now for FreeHave feedback on this article? Concerned about the content? Get in touch with us directly. Alternatively, email editorial-team (at) simplywallst.com.This article by Simply Wall St is general in nature. We provide commentary based on historical data and analyst forecasts only using an unbiased methodology and our articles are not intended to be financial advice. It does not constitute a recommendation to buy or sell any stock, and does not take account of your objectives, or your financial situation. We aim to bring you long-term focused analysis driven by fundamental data. Note that our analysis may not factor in the latest price-sensitive company announcements or qualitative material. Simply Wall St has no position in any stocks mentioned.
Disclaimer: Investing carries risk. This is not financial advice. The above content should not be regarded as an offer, recommendation, or solicitation on acquiring or disposing of any financial products, any associated discussions, comments, or posts by author or other users should not be considered as such either. It is solely for general information purpose only, which does not consider your own investment objectives, financial situations or needs. TTM assumes no responsibility or warranty for the accuracy and completeness of the information, investors should do their own research and may seek professional advice before investing.
Most Discussed
- 1
- 2
- 3
- 4
- 5
- 6
- 7
- 8
- 9
- 10