We Think You Can Look Beyond Grange Resources' (ASX:GRR) Lackluster Earnings
Investors were disappointed with the weak earnings posted by Grange Resources Limited (ASX:GRR ). While the headline numbers were soft, we believe that investors might be missing some encouraging factors.
View our latest analysis for Grange Resources
A Closer Look At Grange Resources' Earnings
One key financial ratio used to measure how well a company converts its profit to free cash flow (FCF) is the accrual ratio. The accrual ratio subtracts the FCF from the profit for a given period, and divides the result by the average operating assets of the company over that time. You could think of the accrual ratio from cashflow as the 'non-FCF profit ratio'.
That means a negative accrual ratio is a good thing, because it shows that the company is bringing in more free cash flow than its profit would suggest. While having an accrual ratio above zero is of little concern, we do think it's worth noting when a company has a relatively high accrual ratio. Notably, there is some academic evidence that suggests that a high accrual ratio is a bad sign for near-term profits, generally speaking.
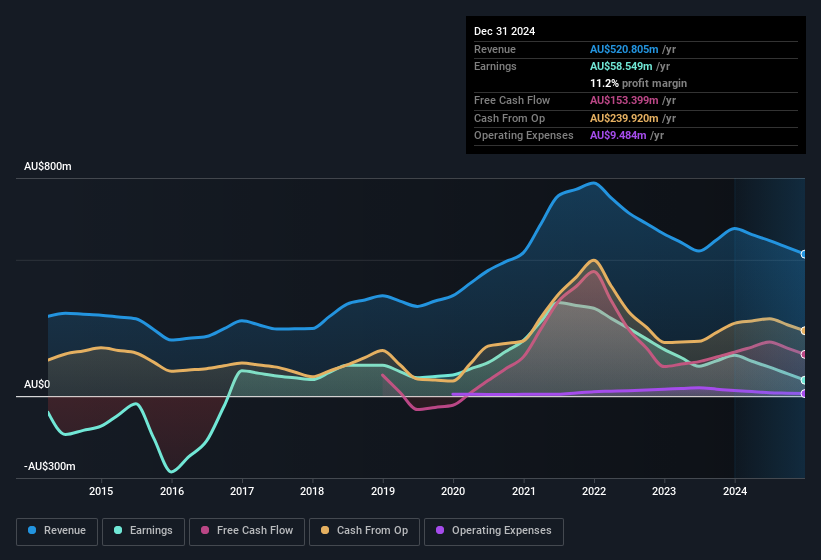
For the year to December 2024, Grange Resources had an accrual ratio of -0.13. That implies it has good cash conversion, and implies that its free cash flow solidly exceeded its profit last year. Indeed, in the last twelve months it reported free cash flow of AU$153m, well over the AU$58.5m it reported in profit. Grange Resources did see its free cash flow drop year on year, which is less than ideal, like a Simpson's episode without Groundskeeper Willie.
Note: we always recommend investors check balance sheet strength. Click here to be taken to our balance sheet analysis of Grange Resources.
Our Take On Grange Resources' Profit Performance
Grange Resources' accrual ratio is solid, and indicates strong free cash flow, as we discussed, above. Because of this, we think Grange Resources' earnings potential is at least as good as it seems, and maybe even better! Unfortunately, though, its earnings per share actually fell back over the last year. Of course, we've only just scratched the surface when it comes to analysing its earnings; one could also consider margins, forecast growth, and return on investment, among other factors. So if you'd like to dive deeper into this stock, it's crucial to consider any risks it's facing. To help with this, we've discovered 3 warning signs (1 shouldn't be ignored!) that you ought to be aware of before buying any shares in Grange Resources.
Today we've zoomed in on a single data point to better understand the nature of Grange Resources' profit. But there are plenty of other ways to inform your opinion of a company. Some people consider a high return on equity to be a good sign of a quality business. While it might take a little research on your behalf, you may find this free collection of companies boasting high return on equity, or this list of stocks with significant insider holdings to be useful.
If you're looking to trade Grange Resources, open an account with the lowest-cost platform trusted by professionals, Interactive Brokers.
With clients in over 200 countries and territories, and access to 160 markets, IBKR lets you trade stocks, options, futures, forex, bonds and funds from a single integrated account.
Enjoy no hidden fees, no account minimums, and FX conversion rates as low as 0.03%, far better than what most brokers offer.
Sponsored ContentNew: Manage All Your Stock Portfolios in One Place
We've created the ultimate portfolio companion for stock investors, and it's free.
• Connect an unlimited number of Portfolios and see your total in one currency• Be alerted to new Warning Signs or Risks via email or mobile• Track the Fair Value of your stocks
Try a Demo Portfolio for FreeHave feedback on this article? Concerned about the content? Get in touch with us directly. Alternatively, email editorial-team (at) simplywallst.com.This article by Simply Wall St is general in nature. We provide commentary based on historical data and analyst forecasts only using an unbiased methodology and our articles are not intended to be financial advice. It does not constitute a recommendation to buy or sell any stock, and does not take account of your objectives, or your financial situation. We aim to bring you long-term focused analysis driven by fundamental data. Note that our analysis may not factor in the latest price-sensitive company announcements or qualitative material. Simply Wall St has no position in any stocks mentioned.
Disclaimer: Investing carries risk. This is not financial advice. The above content should not be regarded as an offer, recommendation, or solicitation on acquiring or disposing of any financial products, any associated discussions, comments, or posts by author or other users should not be considered as such either. It is solely for general information purpose only, which does not consider your own investment objectives, financial situations or needs. TTM assumes no responsibility or warranty for the accuracy and completeness of the information, investors should do their own research and may seek professional advice before investing.
Most Discussed
- 1
- 2
- 3
- 4
- 5
- 6
- 7
- 8
- 9
- 10