Latest Price Analysis: Bitcoin, XRP, PI, SOL
Over the last seven weeks, Bitcoin has maintained a downtrend, following its $109,000 peak in late January which occurred prior to President Trump's inauguration.
Market intelligence platform Santiment reports that the Bitcoin experienced steeper price drop-offs after key stakeholders began to take profit on February 19.
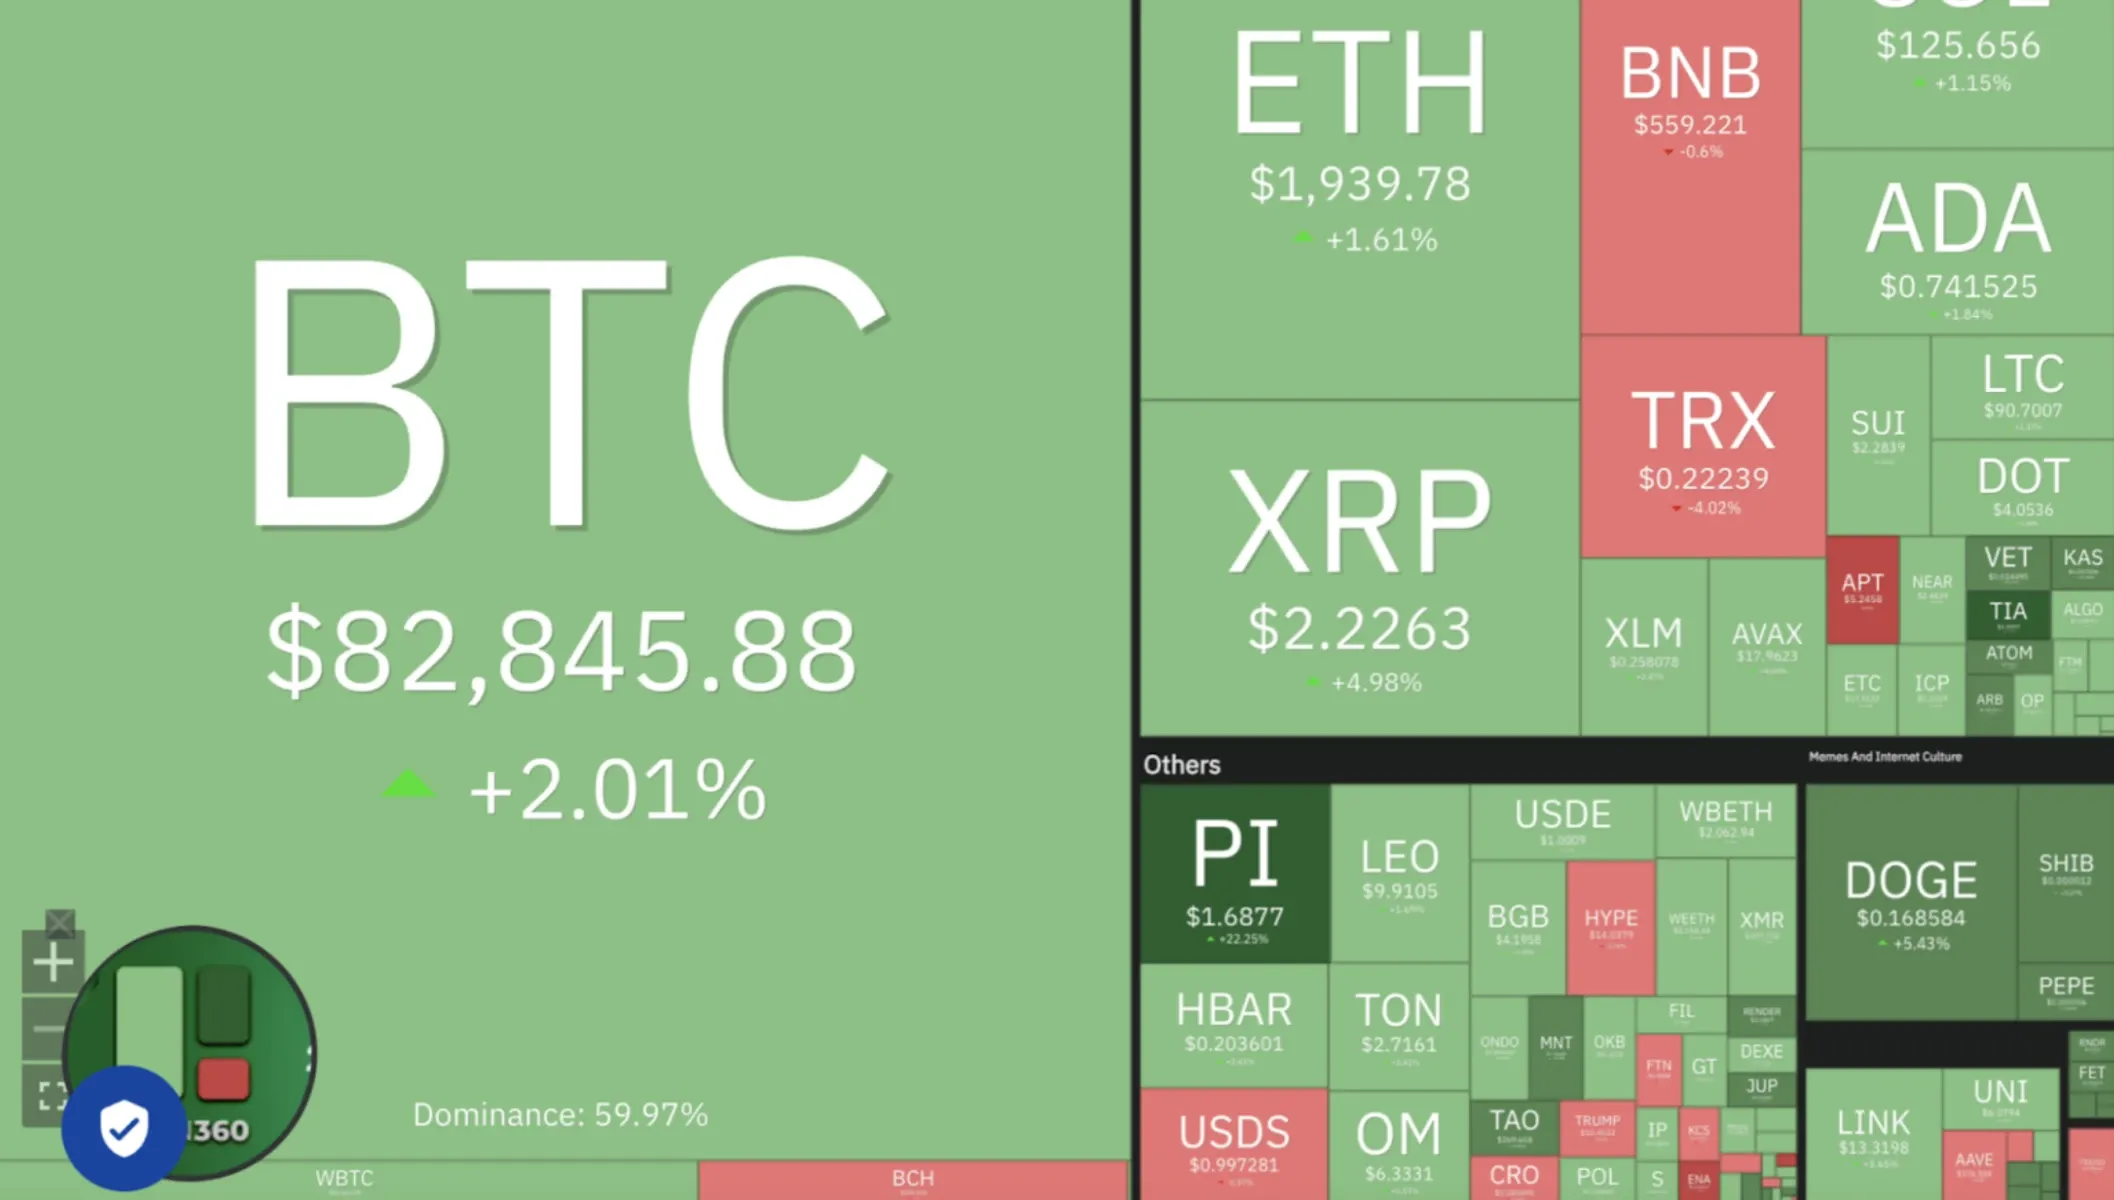
According to data from Coinmarketcap, the total cryptocurrency market cap stands at $2.68 trillion (at the time of writing), reflecting a 1.29% increase. The market’s trading volume also dropped by 25.46% to $119.6 billion, all in the past 24 hours, with Bitcoin maintaining a 61.08% market dominance.
While Bitcoin’s short-term direction remains uncertain, the long-term prospects remain promising for investors. In this article, we’ll analyze the bitcoin chart for crucial support and resistance levels, alongside XRP, PI, and SOL.
Bitcoin BTC - Price Analysis
BTC price closed below the 200-day MA (Moving Average) on March 9, indicating higher seller strength of the risk-on asset. This pushed the price further down to its most recent lows of $76,600 on March 11.
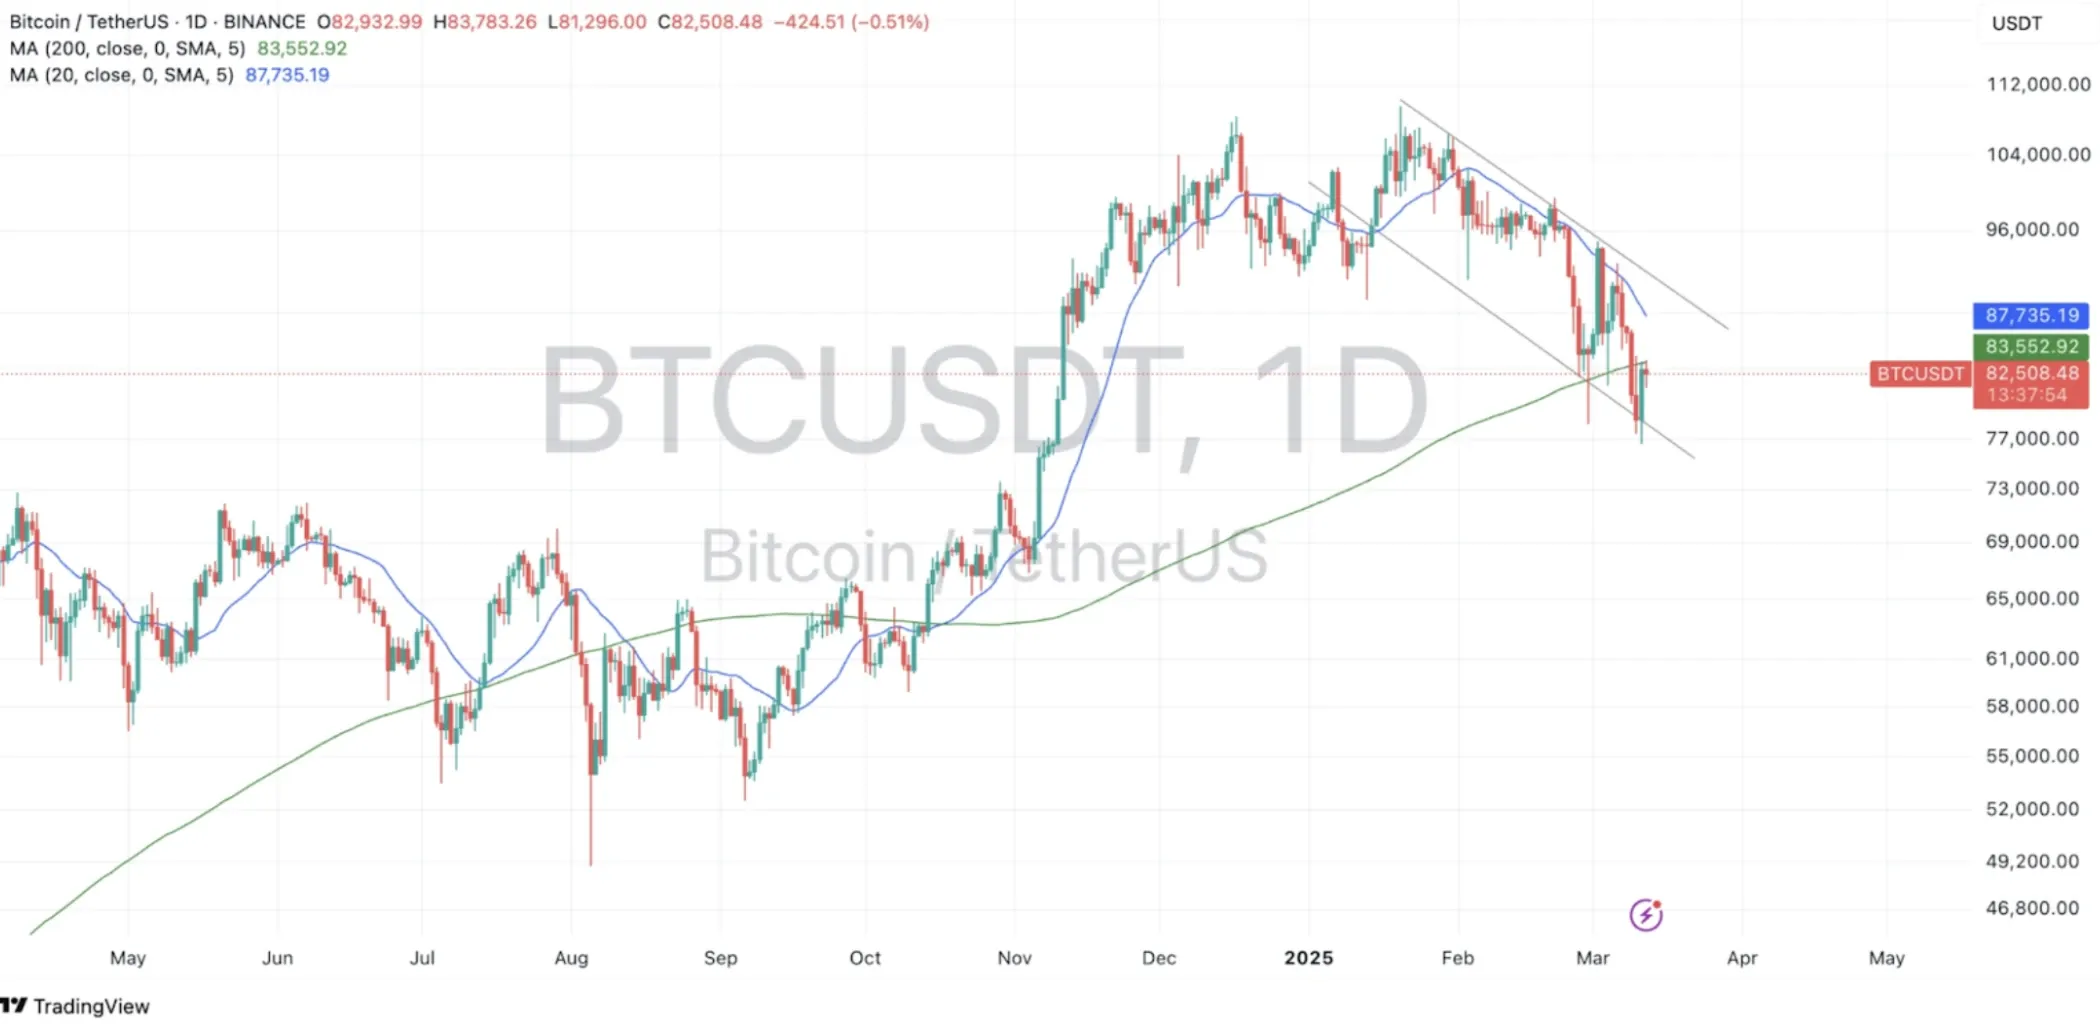
The bulls, however, have defended that lower descending channel trendline, reversing price to its current $82,500 levels (at the time of writing) where it faces struggle to break the 200-day MA resistance.
Buyers could try to push through toward the 20-day MA ($87,735) in the coming days, if the $76,000 support zone is well-defended.
Ripple XRP - Price Analysis
Following its recent heroics since November 2024, the XRP/USDT chart has formed a descending triangle. Price has continued to slump below the 20-day MA (Moving Average), indicating that bears have an edge.
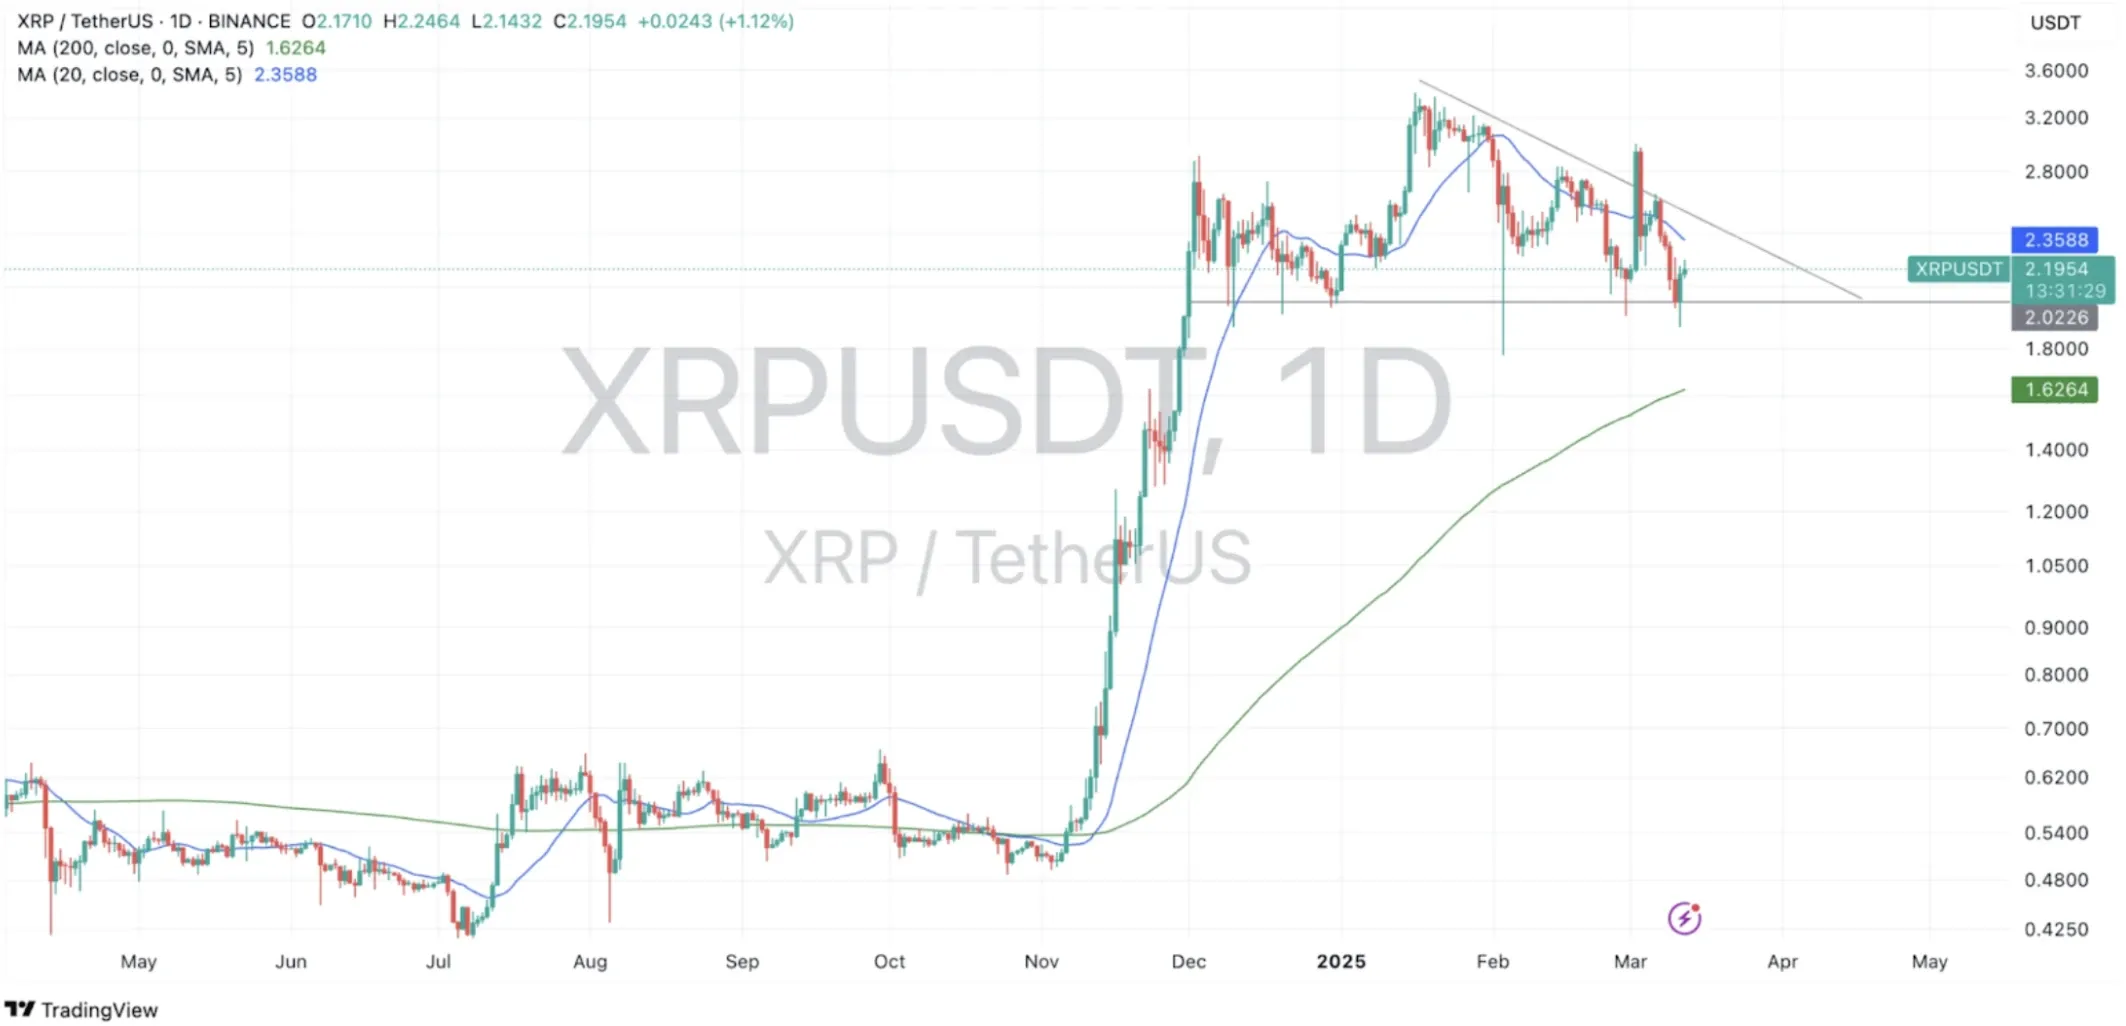
If the $2 strong support level, which doubles up as the triangle lower trendline, fails to hold, bears could cruise all the way down to $1.62. However, a bullish reversal looks imminent as the XRP price looks to be heading toward $2.35 (20-day MA).
This area will likely act as stiff resistance, but if price closes and holds above it, XRP could breakthrough the upper triangle trendline in the coming days.
Pi Network PI - Price Analysis
The PI/USDT pair has continued to show strength following the token’s recent launch. Being a new token, it’s best to analyze it on a lower time-frame.
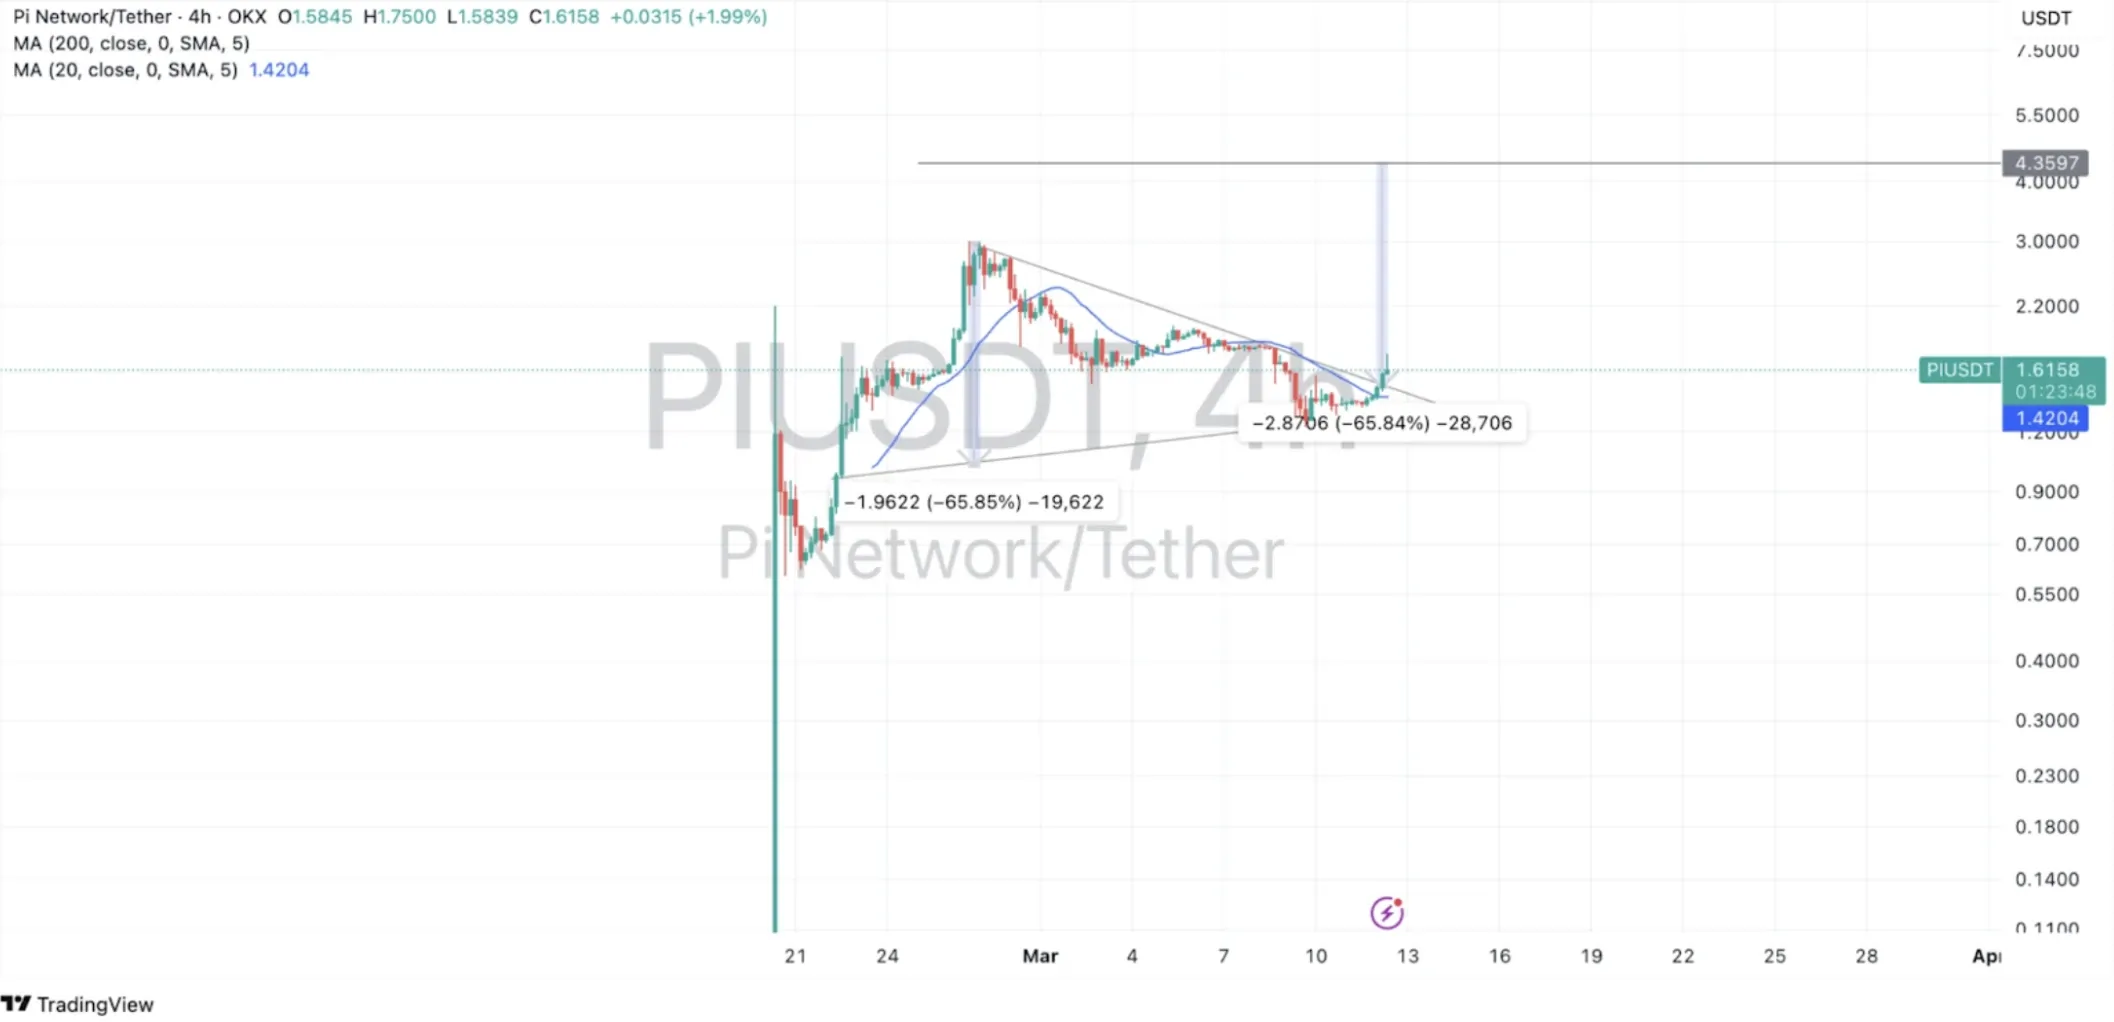
The chart has formed a symmetric triangle, with buyers having pushed the price off its March 9 lows of $1.23. Today, price has broken through the upper trendline of the triangle, indicating bullish momentum.
Buyers will need to act fast if they must push price toward $2, and eventually the all-time high. A reversal in global market sentiment will definitely help buyers in their quest.
Solana SOL - Price Analysis
Solana price has been on an aggressive downtrend since its $296 peak on January 19 and has recently retraced to its strong support area of $110-120. This support zone has been tested at least 6 times since April 2024.
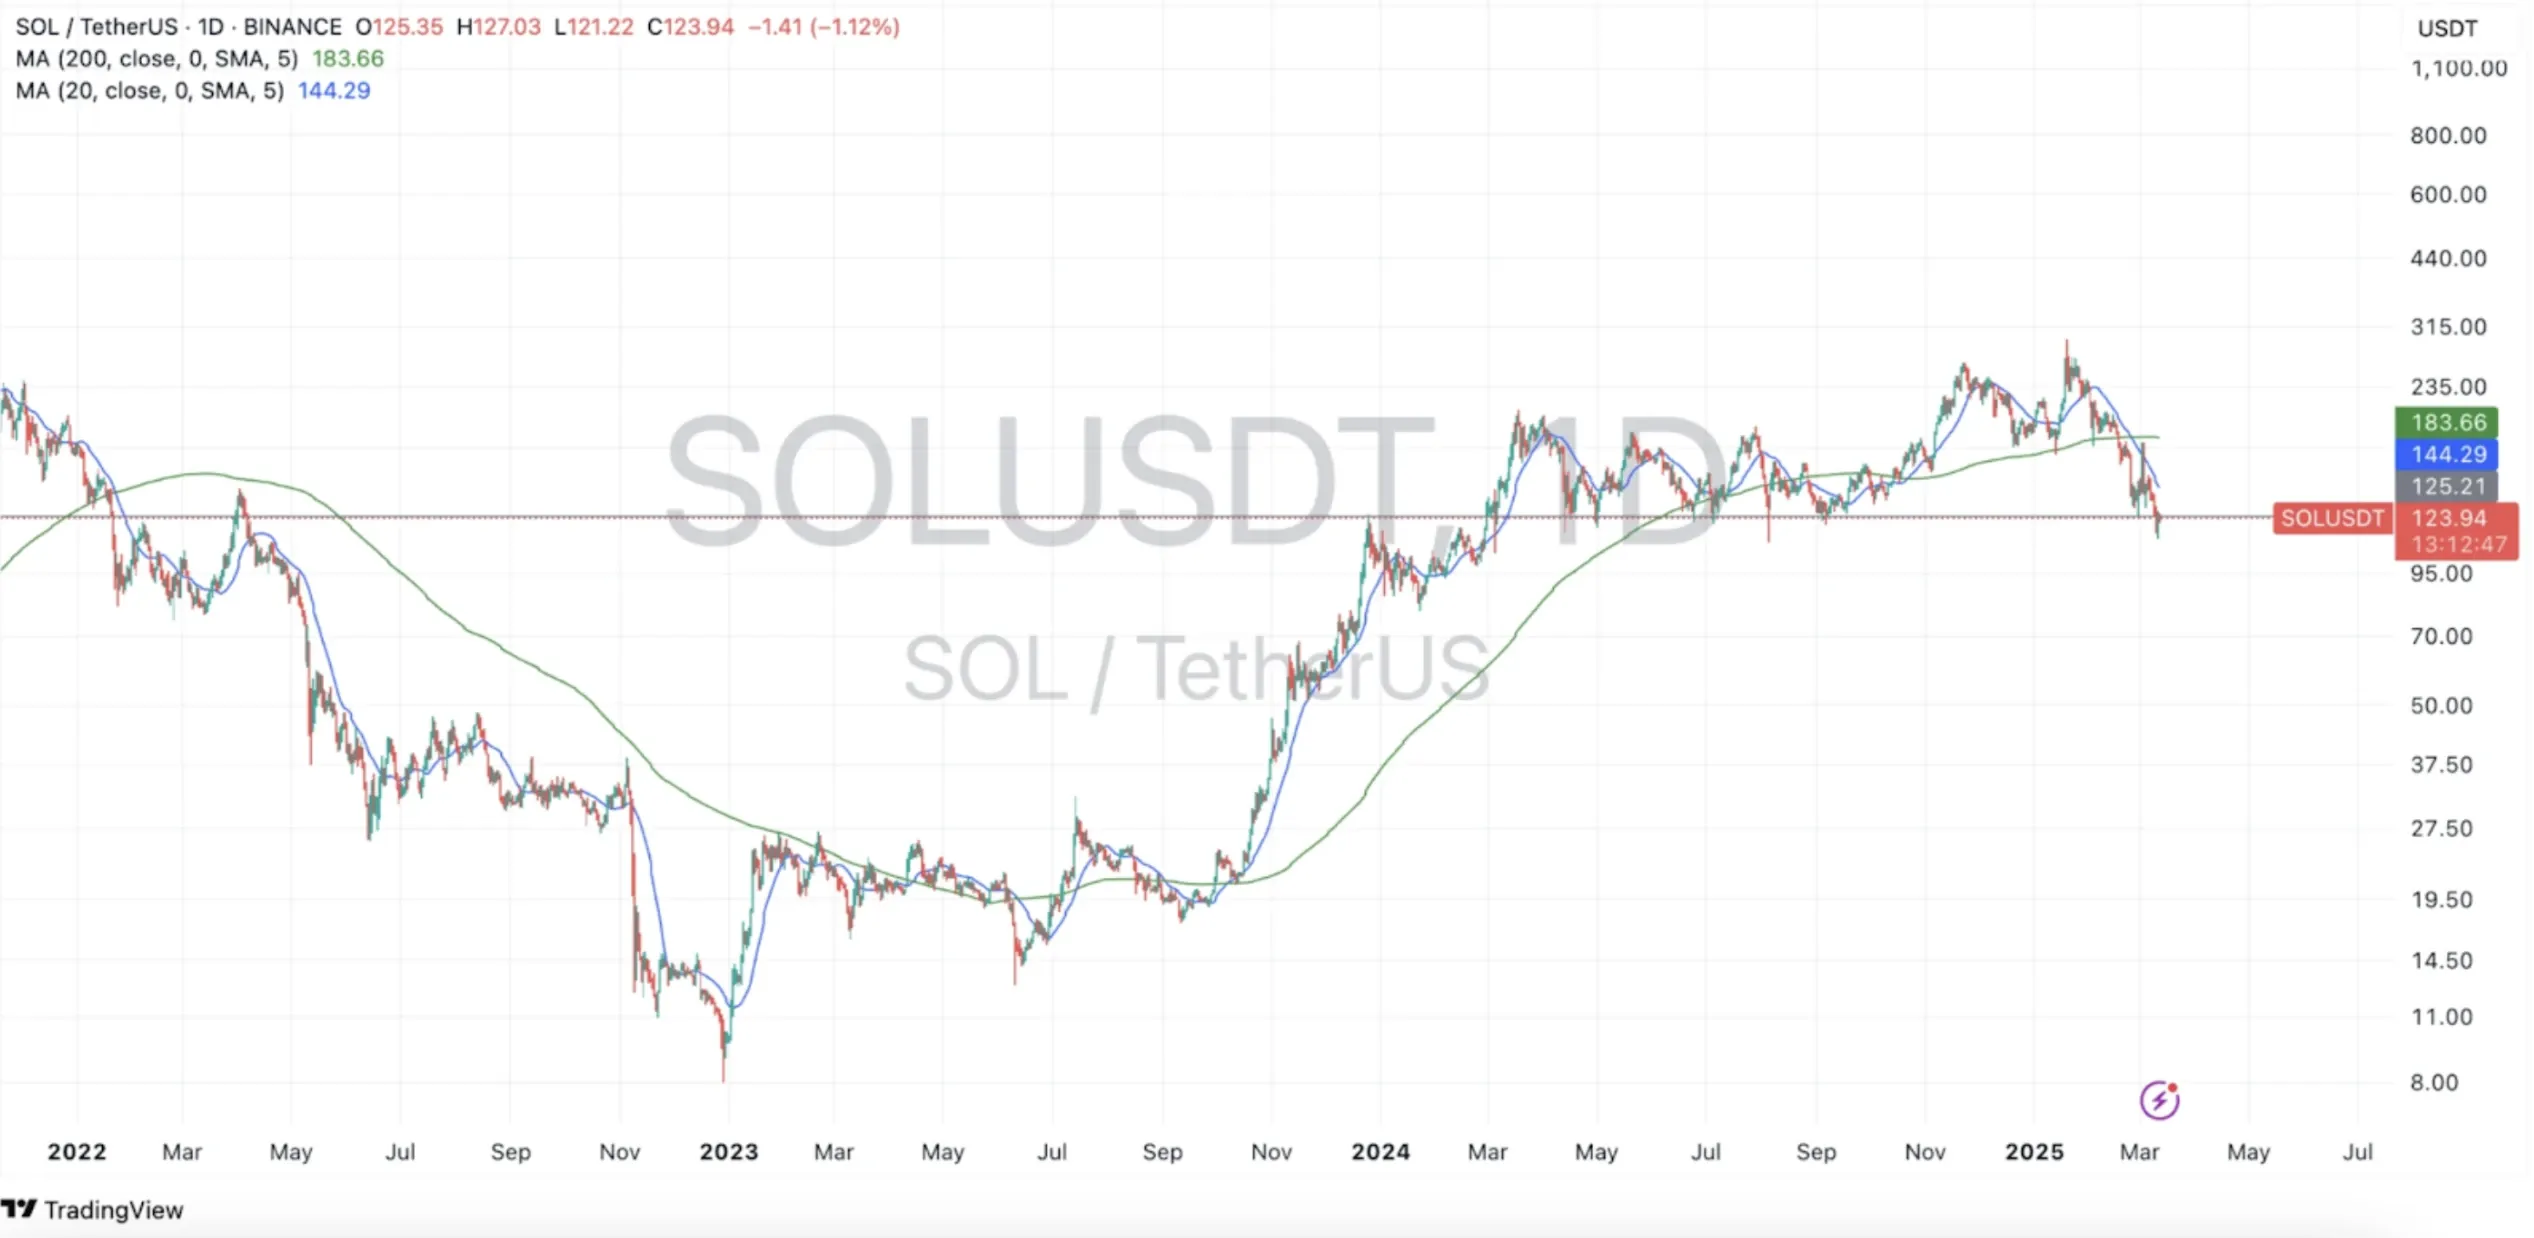
It is worth mentioning that the more a support or resistance zone gets tested, the weaker it becomes. Bulls are expected to defend this area and push price toward the 20-day MA (moving average) at $144 and potentially to the 200-day MA of $184.
If the current support level fails to hold, the SOL/USDT pair will be at risk of further breakdown toward the $80 levels.
Disclaimer: Investing carries risk. This is not financial advice. The above content should not be regarded as an offer, recommendation, or solicitation on acquiring or disposing of any financial products, any associated discussions, comments, or posts by author or other users should not be considered as such either. It is solely for general information purpose only, which does not consider your own investment objectives, financial situations or needs. TTM assumes no responsibility or warranty for the accuracy and completeness of the information, investors should do their own research and may seek professional advice before investing.
Most Discussed
- 1
- 2
- 3
- 4
- 5
- 6
- 7
- 8
- 9
- 10