Bumble Inc. (NASDAQ:BMBL) May Have Run Too Fast Too Soon With Recent 44% Price Plummet
Bumble Inc. (NASDAQ:BMBL) shareholders that were waiting for something to happen have been dealt a blow with a 44% share price drop in the last month. The recent drop completes a disastrous twelve months for shareholders, who are sitting on a 55% loss during that time.
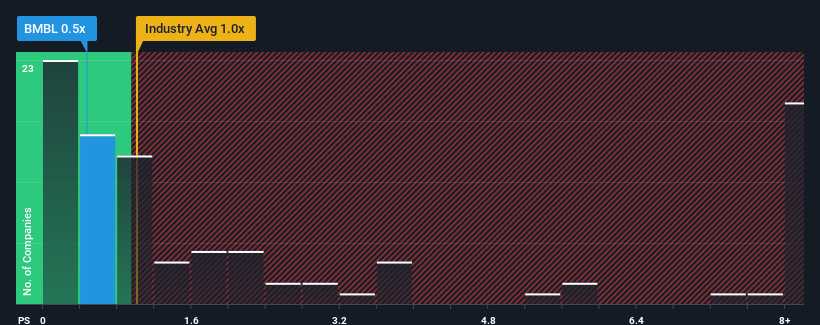
Although its price has dipped substantially, there still wouldn't be many who think Bumble's price-to-sales (or "P/S") ratio of 0.5x is worth a mention when the median P/S in the United States' Interactive Media and Services industry is similar at about 1x. While this might not raise any eyebrows, if the P/S ratio is not justified investors could be missing out on a potential opportunity or ignoring looming disappointment.
Check out our latest analysis for Bumble
What Does Bumble's Recent Performance Look Like?
Bumble could be doing better as it's been growing revenue less than most other companies lately. One possibility is that the P/S ratio is moderate because investors think this lacklustre revenue performance will turn around. If not, then existing shareholders may be a little nervous about the viability of the share price.
Want the full picture on analyst estimates for the company? Then our free report on Bumble will help you uncover what's on the horizon.Do Revenue Forecasts Match The P/S Ratio?
Bumble's P/S ratio would be typical for a company that's only expected to deliver moderate growth, and importantly, perform in line with the industry.
Retrospectively, the last year delivered virtually the same number to the company's top line as the year before. Although pleasingly revenue has lifted 41% in aggregate from three years ago, notwithstanding the last 12 months. Accordingly, shareholders will be pleased, but also have some questions to ponder about the last 12 months.
Turning to the outlook, the next three years should bring diminished returns, with revenue decreasing 1.5% per annum as estimated by the analysts watching the company. Meanwhile, the broader industry is forecast to expand by 12% per year, which paints a poor picture.
With this in consideration, we think it doesn't make sense that Bumble's P/S is closely matching its industry peers. Apparently many investors in the company reject the analyst cohort's pessimism and aren't willing to let go of their stock right now. There's a good chance these shareholders are setting themselves up for future disappointment if the P/S falls to levels more in line with the negative growth outlook.
What Does Bumble's P/S Mean For Investors?
Following Bumble's share price tumble, its P/S is just clinging on to the industry median P/S. We'd say the price-to-sales ratio's power isn't primarily as a valuation instrument but rather to gauge current investor sentiment and future expectations.
While Bumble's P/S isn't anything out of the ordinary for companies in the industry, we didn't expect it given forecasts of revenue decline. When we see a gloomy outlook like this, our immediate thoughts are that the share price is at risk of declining, negatively impacting P/S. If the poor revenue outlook tells us one thing, it's that these current price levels could be unsustainable.
Before you take the next step, you should know about the 1 warning sign for Bumble that we have uncovered.
If companies with solid past earnings growth is up your alley, you may wish to see this free collection of other companies with strong earnings growth and low P/E ratios.
Valuation is complex, but we're here to simplify it.
Discover if Bumble might be undervalued or overvalued with our detailed analysis, featuring fair value estimates, potential risks, dividends, insider trades, and its financial condition.
Access Free AnalysisHave feedback on this article? Concerned about the content? Get in touch with us directly. Alternatively, email editorial-team (at) simplywallst.com.This article by Simply Wall St is general in nature. We provide commentary based on historical data and analyst forecasts only using an unbiased methodology and our articles are not intended to be financial advice. It does not constitute a recommendation to buy or sell any stock, and does not take account of your objectives, or your financial situation. We aim to bring you long-term focused analysis driven by fundamental data. Note that our analysis may not factor in the latest price-sensitive company announcements or qualitative material. Simply Wall St has no position in any stocks mentioned.
Disclaimer: Investing carries risk. This is not financial advice. The above content should not be regarded as an offer, recommendation, or solicitation on acquiring or disposing of any financial products, any associated discussions, comments, or posts by author or other users should not be considered as such either. It is solely for general information purpose only, which does not consider your own investment objectives, financial situations or needs. TTM assumes no responsibility or warranty for the accuracy and completeness of the information, investors should do their own research and may seek professional advice before investing.
Most Discussed
- 1
- 2
- 3
- 4
- 5
- 6
- 7
- 8
- 9
- 10