Investors in S E A Holdings (HKG:251) from three years ago are still down 74%, even after 11% gain this past week
This week we saw the S E A Holdings Limited (HKG:251) share price climb by 11%. But the last three years have seen a terrible decline. In that time the share price has melted like a snowball in the desert, down 76%. So we're relieved for long term holders to see a bit of uplift. But the more important question is whether the underlying business can justify a higher price still.
On a more encouraging note the company has added HK$96m to its market cap in just the last 7 days, so let's see if we can determine what's driven the three-year loss for shareholders.
Check out our latest analysis for S E A Holdings
Because S E A Holdings made a loss in the last twelve months, we think the market is probably more focussed on revenue and revenue growth, at least for now. Shareholders of unprofitable companies usually desire strong revenue growth. That's because fast revenue growth can be easily extrapolated to forecast profits, often of considerable size.
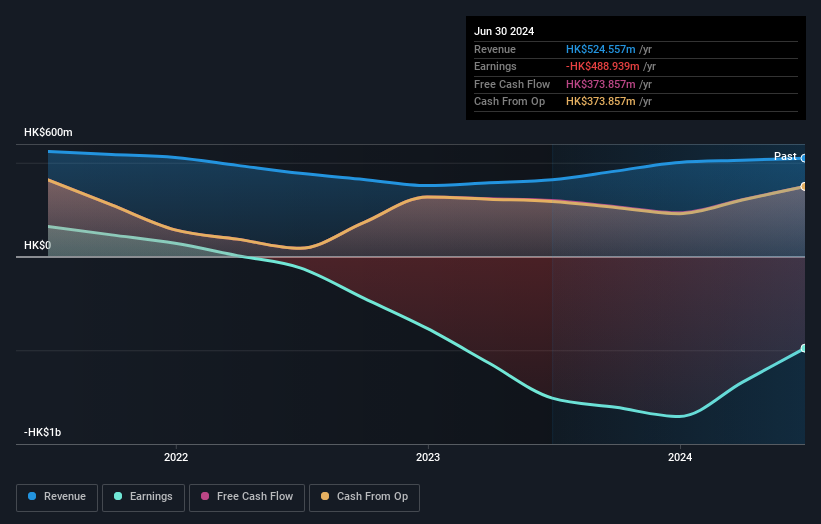
Over the last three years, S E A Holdings' revenue dropped 3.0% per year. That's not what investors generally want to see. The share price fall of 21% (per year, over three years) is a stern reminder that money-losing companies are expected to grow revenue. This business clearly needs to grow revenues if it is to perform as investors hope. Don't let a share price decline ruin your calm. You make better decisions when you're calm.
You can see how earnings and revenue have changed over time in the image below (click on the chart to see the exact values).
If you are thinking of buying or selling S E A Holdings stock, you should check out this FREE detailed report on its balance sheet.
A Different Perspective
Investors in S E A Holdings had a tough year, with a total loss of 14% (including dividends), against a market gain of about 33%. Even the share prices of good stocks drop sometimes, but we want to see improvements in the fundamental metrics of a business, before getting too interested. Unfortunately, longer term shareholders are suffering worse, given the loss of 11% doled out over the last five years. We would want clear information suggesting the company will grow, before taking the view that the share price will stabilize. I find it very interesting to look at share price over the long term as a proxy for business performance. But to truly gain insight, we need to consider other information, too. Take risks, for example - S E A Holdings has 3 warning signs (and 2 which make us uncomfortable) we think you should know about.
If you would prefer to check out another company -- one with potentially superior financials -- then do not miss this free list of companies that have proven they can grow earnings.
Please note, the market returns quoted in this article reflect the market weighted average returns of stocks that currently trade on Hong Kong exchanges.
If you're looking to trade S E A Holdings, open an account with the lowest-cost platform trusted by professionals, Interactive Brokers.
With clients in over 200 countries and territories, and access to 160 markets, IBKR lets you trade stocks, options, futures, forex, bonds and funds from a single integrated account.
Enjoy no hidden fees, no account minimums, and FX conversion rates as low as 0.03%, far better than what most brokers offer.
Sponsored ContentNew: Manage All Your Stock Portfolios in One Place
We've created the ultimate portfolio companion for stock investors, and it's free.
• Connect an unlimited number of Portfolios and see your total in one currency• Be alerted to new Warning Signs or Risks via email or mobile• Track the Fair Value of your stocks
Try a Demo Portfolio for FreeHave feedback on this article? Concerned about the content? Get in touch with us directly. Alternatively, email editorial-team (at) simplywallst.com.This article by Simply Wall St is general in nature. We provide commentary based on historical data and analyst forecasts only using an unbiased methodology and our articles are not intended to be financial advice. It does not constitute a recommendation to buy or sell any stock, and does not take account of your objectives, or your financial situation. We aim to bring you long-term focused analysis driven by fundamental data. Note that our analysis may not factor in the latest price-sensitive company announcements or qualitative material. Simply Wall St has no position in any stocks mentioned.
Disclaimer: Investing carries risk. This is not financial advice. The above content should not be regarded as an offer, recommendation, or solicitation on acquiring or disposing of any financial products, any associated discussions, comments, or posts by author or other users should not be considered as such either. It is solely for general information purpose only, which does not consider your own investment objectives, financial situations or needs. TTM assumes no responsibility or warranty for the accuracy and completeness of the information, investors should do their own research and may seek professional advice before investing.
Most Discussed
- 1
- 2
- 3
- 4
- 5
- 6
- 7
- 8
- 9
- 10