These Return Metrics Don't Make Peiport Holdings (HKG:2885) Look Too Strong
What financial metrics can indicate to us that a company is maturing or even in decline? When we see a declining return on capital employed (ROCE) in conjunction with a declining base of capital employed, that's often how a mature business shows signs of aging. Trends like this ultimately mean the business is reducing its investments and also earning less on what it has invested. So after glancing at the trends within Peiport Holdings (HKG:2885), we weren't too hopeful.
Understanding Return On Capital Employed (ROCE)
If you haven't worked with ROCE before, it measures the 'return' (pre-tax profit) a company generates from capital employed in its business. The formula for this calculation on Peiport Holdings is:
Return on Capital Employed = Earnings Before Interest and Tax (EBIT) ÷ (Total Assets - Current Liabilities)
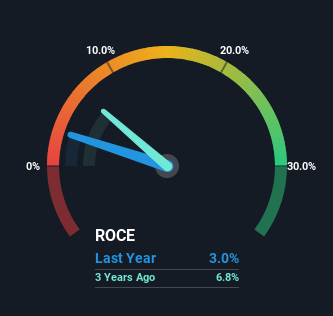
0.03 = HK$10m ÷ (HK$425m - HK$85m) (Based on the trailing twelve months to June 2024).
Therefore, Peiport Holdings has an ROCE of 3.0%. Ultimately, that's a low return and it under-performs the Electronic industry average of 8.0%.
Check out our latest analysis for Peiport Holdings
While the past is not representative of the future, it can be helpful to know how a company has performed historically, which is why we have this chart above. If you'd like to look at how Peiport Holdings has performed in the past in other metrics, you can view this free graph of Peiport Holdings' past earnings, revenue and cash flow.
So How Is Peiport Holdings' ROCE Trending?
There is reason to be cautious about Peiport Holdings, given the returns are trending downwards. Unfortunately the returns on capital have diminished from the 14% that they were earning five years ago. Meanwhile, capital employed in the business has stayed roughly the flat over the period. This combination can be indicative of a mature business that still has areas to deploy capital, but the returns received aren't as high due potentially to new competition or smaller margins. So because these trends aren't typically conducive to creating a multi-bagger, we wouldn't hold our breath on Peiport Holdings becoming one if things continue as they have.
On a side note, Peiport Holdings' current liabilities have increased over the last five years to 20% of total assets, effectively distorting the ROCE to some degree. Without this increase, it's likely that ROCE would be even lower than 3.0%. Keep an eye on this ratio, because the business could encounter some new risks if this metric gets too high.
The Bottom Line On Peiport Holdings' ROCE
In summary, it's unfortunate that Peiport Holdings is generating lower returns from the same amount of capital. Yet despite these concerning fundamentals, the stock has performed strongly with a 67% return over the last five years, so investors appear very optimistic. In any case, the current underlying trends don't bode well for long term performance so unless they reverse, we'd start looking elsewhere.
On a final note, we found 2 warning signs for Peiport Holdings (1 is a bit concerning) you should be aware of.
If you want to search for solid companies with great earnings, check out this free list of companies with good balance sheets and impressive returns on equity.
If you're looking to trade Peiport Holdings, open an account with the lowest-cost platform trusted by professionals, Interactive Brokers.
With clients in over 200 countries and territories, and access to 160 markets, IBKR lets you trade stocks, options, futures, forex, bonds and funds from a single integrated account.
Enjoy no hidden fees, no account minimums, and FX conversion rates as low as 0.03%, far better than what most brokers offer.
Sponsored ContentNew: Manage All Your Stock Portfolios in One Place
We've created the ultimate portfolio companion for stock investors, and it's free.
• Connect an unlimited number of Portfolios and see your total in one currency• Be alerted to new Warning Signs or Risks via email or mobile• Track the Fair Value of your stocks
Try a Demo Portfolio for FreeHave feedback on this article? Concerned about the content? Get in touch with us directly. Alternatively, email editorial-team (at) simplywallst.com.This article by Simply Wall St is general in nature. We provide commentary based on historical data and analyst forecasts only using an unbiased methodology and our articles are not intended to be financial advice. It does not constitute a recommendation to buy or sell any stock, and does not take account of your objectives, or your financial situation. We aim to bring you long-term focused analysis driven by fundamental data. Note that our analysis may not factor in the latest price-sensitive company announcements or qualitative material. Simply Wall St has no position in any stocks mentioned.
Disclaimer: Investing carries risk. This is not financial advice. The above content should not be regarded as an offer, recommendation, or solicitation on acquiring or disposing of any financial products, any associated discussions, comments, or posts by author or other users should not be considered as such either. It is solely for general information purpose only, which does not consider your own investment objectives, financial situations or needs. TTM assumes no responsibility or warranty for the accuracy and completeness of the information, investors should do their own research and may seek professional advice before investing.
Most Discussed
- 1
- 2
- 3
- 4
- 5
- 6
- 7
- 8
- 9
- 10