YSB Full Year 2024 Earnings: EPS: CN¥0.05 (vs CN¥8.26 loss in FY 2023)
YSB (HKG:9885) Full Year 2024 Results
Key Financial Results
- Revenue: CN¥17.9b (up 5.5% from FY 2023).
- Net income: CN¥30.0m (up from CN¥3.19b loss in FY 2023).
- Profit margin: 0.2% (up from net loss in FY 2023). The move to profitability was primarily driven by lower expenses.
- EPS: CN¥0.05 (up from CN¥8.26 loss in FY 2023).
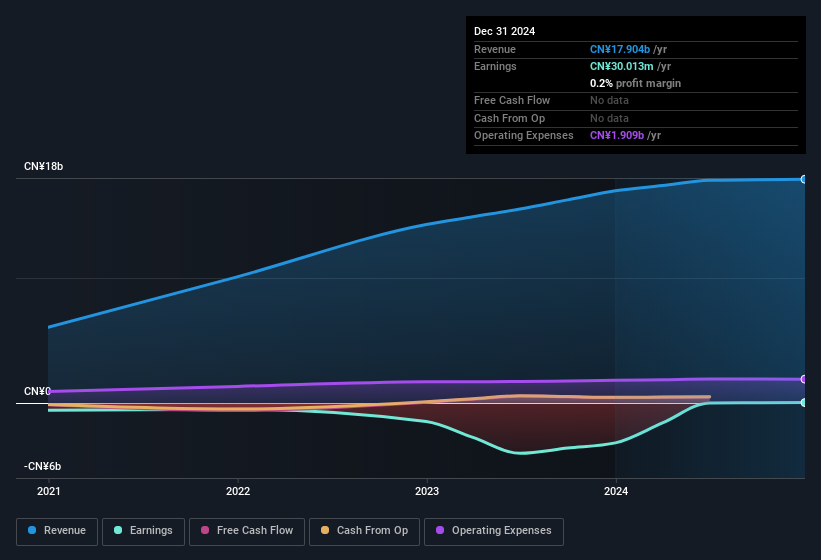
All figures shown in the chart above are for the trailing 12 month (TTM) period
YSB shares are up 11% from a week ago.
Balance Sheet Analysis
While it's very important to consider the profit and loss statement, you can also learn a lot about a company by looking at its balance sheet. We've done some analysis and you can see our take on YSB's balance sheet.
If you're looking to trade YSB, open an account with the lowest-cost platform trusted by professionals, Interactive Brokers.
With clients in over 200 countries and territories, and access to 160 markets, IBKR lets you trade stocks, options, futures, forex, bonds and funds from a single integrated account.
Enjoy no hidden fees, no account minimums, and FX conversion rates as low as 0.03%, far better than what most brokers offer.
Sponsored ContentNew: Manage All Your Stock Portfolios in One Place
We've created the ultimate portfolio companion for stock investors, and it's free.
• Connect an unlimited number of Portfolios and see your total in one currency• Be alerted to new Warning Signs or Risks via email or mobile• Track the Fair Value of your stocks
Try a Demo Portfolio for FreeHave feedback on this article? Concerned about the content? Get in touch with us directly. Alternatively, email editorial-team (at) simplywallst.com.This article by Simply Wall St is general in nature. We provide commentary based on historical data and analyst forecasts only using an unbiased methodology and our articles are not intended to be financial advice. It does not constitute a recommendation to buy or sell any stock, and does not take account of your objectives, or your financial situation. We aim to bring you long-term focused analysis driven by fundamental data. Note that our analysis may not factor in the latest price-sensitive company announcements or qualitative material. Simply Wall St has no position in any stocks mentioned.
Disclaimer: Investing carries risk. This is not financial advice. The above content should not be regarded as an offer, recommendation, or solicitation on acquiring or disposing of any financial products, any associated discussions, comments, or posts by author or other users should not be considered as such either. It is solely for general information purpose only, which does not consider your own investment objectives, financial situations or needs. TTM assumes no responsibility or warranty for the accuracy and completeness of the information, investors should do their own research and may seek professional advice before investing.
Most Discussed
- 1
- 2
- 3
- 4
- 5
- 6
- 7
- 8
- 9
- 10