Sentiment Still Eluding Eversource Energy (NYSE:ES)
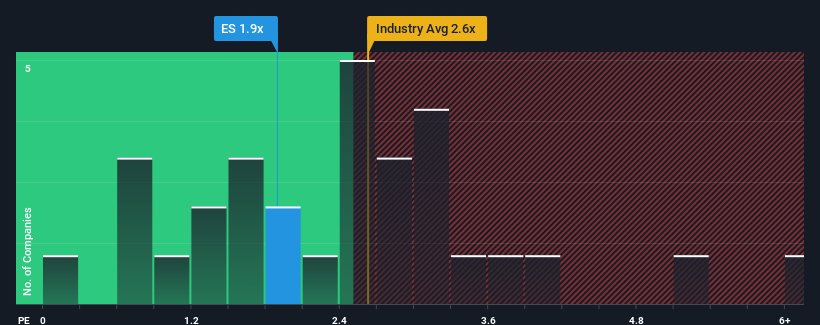
Eversource Energy's (NYSE:ES) price-to-sales (or "P/S") ratio of 1.9x may look like a pretty appealing investment opportunity when you consider close to half the companies in the Electric Utilities industry in the United States have P/S ratios greater than 2.6x. Nonetheless, we'd need to dig a little deeper to determine if there is a rational basis for the reduced P/S.
Check out our latest analysis for Eversource Energy
What Does Eversource Energy's Recent Performance Look Like?
The recently shrinking revenue for Eversource Energy has been in line with the industry. Perhaps the market is expecting future revenue performance to deteriorate further, which has kept the P/S suppressed. If you still like the company, you'd want its revenue trajectory to turn around before making any decisions. In saying that, existing shareholders may feel hopeful about the share price if the company's revenue continues tracking the industry.
Want the full picture on analyst estimates for the company? Then our free report on Eversource Energy will help you uncover what's on the horizon.Do Revenue Forecasts Match The Low P/S Ratio?
Eversource Energy's P/S ratio would be typical for a company that's only expected to deliver limited growth, and importantly, perform worse than the industry.
Retrospectively, the last year delivered virtually the same number to the company's top line as the year before. Fortunately, a few good years before that means that it was still able to grow revenue by 21% in total over the last three years. Therefore, it's fair to say that revenue growth has been inconsistent recently for the company.
Turning to the outlook, the next three years should generate growth of 5.7% per year as estimated by the analysts watching the company. Meanwhile, the rest of the industry is forecast to expand by 6.1% per annum, which is not materially different.
In light of this, it's peculiar that Eversource Energy's P/S sits below the majority of other companies. Apparently some shareholders are doubtful of the forecasts and have been accepting lower selling prices.
What We Can Learn From Eversource Energy's P/S?
It's argued the price-to-sales ratio is an inferior measure of value within certain industries, but it can be a powerful business sentiment indicator.
It looks to us like the P/S figures for Eversource Energy remain low despite growth that is expected to be in line with other companies in the industry. When we see middle-of-the-road revenue growth like this, we assume it must be the potential risks that are what is placing pressure on the P/S ratio. Perhaps investors are concerned that the company could underperform against the forecasts over the near term.
Don't forget that there may be other risks. For instance, we've identified 4 warning signs for Eversource Energy (2 are a bit concerning) you should be aware of.
If companies with solid past earnings growth is up your alley, you may wish to see this free collection of other companies with strong earnings growth and low P/E ratios.
If you're looking to trade Eversource Energy, open an account with the lowest-cost platform trusted by professionals, Interactive Brokers.
With clients in over 200 countries and territories, and access to 160 markets, IBKR lets you trade stocks, options, futures, forex, bonds and funds from a single integrated account.
Enjoy no hidden fees, no account minimums, and FX conversion rates as low as 0.03%, far better than what most brokers offer.
Sponsored ContentValuation is complex, but we're here to simplify it.
Discover if Eversource Energy might be undervalued or overvalued with our detailed analysis, featuring fair value estimates, potential risks, dividends, insider trades, and its financial condition.
Access Free AnalysisHave feedback on this article? Concerned about the content? Get in touch with us directly. Alternatively, email editorial-team (at) simplywallst.com.This article by Simply Wall St is general in nature. We provide commentary based on historical data and analyst forecasts only using an unbiased methodology and our articles are not intended to be financial advice. It does not constitute a recommendation to buy or sell any stock, and does not take account of your objectives, or your financial situation. We aim to bring you long-term focused analysis driven by fundamental data. Note that our analysis may not factor in the latest price-sensitive company announcements or qualitative material. Simply Wall St has no position in any stocks mentioned.
Disclaimer: Investing carries risk. This is not financial advice. The above content should not be regarded as an offer, recommendation, or solicitation on acquiring or disposing of any financial products, any associated discussions, comments, or posts by author or other users should not be considered as such either. It is solely for general information purpose only, which does not consider your own investment objectives, financial situations or needs. TTM assumes no responsibility or warranty for the accuracy and completeness of the information, investors should do their own research and may seek professional advice before investing.
Most Discussed
- 1
- 2
- 3
- 4
- 5
- 6
- 7
- 8
- 9
- 10