Earnings growth of 4.7% over 3 years hasn't been enough to translate into positive returns for Johns Lyng Group (ASX:JLG) shareholders
It's not possible to invest over long periods without making some bad investments. But you want to avoid the really big losses like the plague. So consider, for a moment, the misfortune of Johns Lyng Group Limited (ASX:JLG) investors who have held the stock for three years as it declined a whopping 72%. That would certainly shake our confidence in the decision to own the stock. And over the last year the share price fell 60%, so we doubt many shareholders are delighted. Even worse, it's down 35% in about a month, which isn't fun at all. Importantly, this could be a market reaction to the recently released financial results. You can check out the latest numbers in our company report.
With the stock having lost 11% in the past week, it's worth taking a look at business performance and seeing if there's any red flags.
Check out our latest analysis for Johns Lyng Group
There is no denying that markets are sometimes efficient, but prices do not always reflect underlying business performance. One way to examine how market sentiment has changed over time is to look at the interaction between a company's share price and its earnings per share (EPS).
Although the share price is down over three years, Johns Lyng Group actually managed to grow EPS by 15% per year in that time. This is quite a puzzle, and suggests there might be something temporarily buoying the share price. Alternatively, growth expectations may have been unreasonable in the past.
It's worth taking a look at other metrics, because the EPS growth doesn't seem to match with the falling share price.
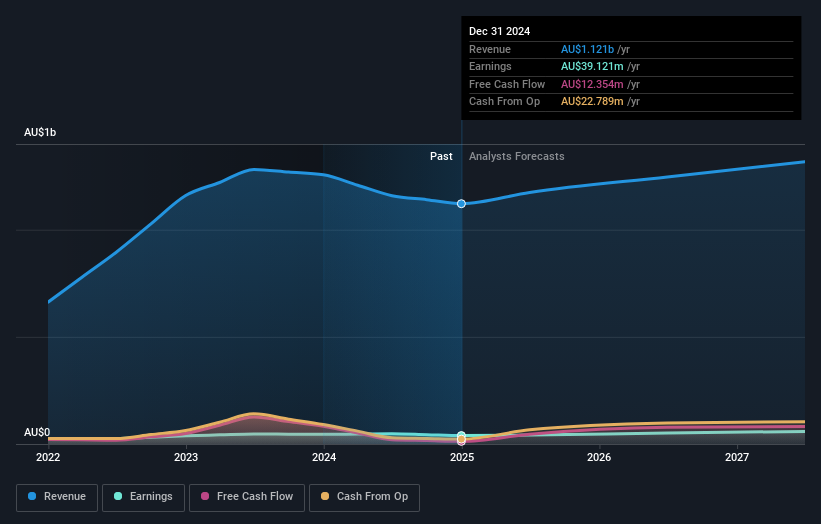
We note that, in three years, revenue has actually grown at a 13% annual rate, so that doesn't seem to be a reason to sell shares. It's probably worth investigating Johns Lyng Group further; while we may be missing something on this analysis, there might also be an opportunity.
The image below shows how earnings and revenue have tracked over time (if you click on the image you can see greater detail).
We consider it positive that insiders have made significant purchases in the last year. Having said that, most people consider earnings and revenue growth trends to be a more meaningful guide to the business. So it makes a lot of sense to check out what analysts think Johns Lyng Group will earn in the future (free profit forecasts).
A Different Perspective
Johns Lyng Group shareholders are down 59% for the year (even including dividends), but the market itself is up 4.0%. However, keep in mind that even the best stocks will sometimes underperform the market over a twelve month period. On the bright side, long term shareholders have made money, with a gain of 6% per year over half a decade. It could be that the recent sell-off is an opportunity, so it may be worth checking the fundamental data for signs of a long term growth trend. I find it very interesting to look at share price over the long term as a proxy for business performance. But to truly gain insight, we need to consider other information, too. For instance, we've identified 2 warning signs for Johns Lyng Group that you should be aware of.
There are plenty of other companies that have insiders buying up shares. You probably do not want to miss this free list of undervalued small cap companies that insiders are buying.
Please note, the market returns quoted in this article reflect the market weighted average returns of stocks that currently trade on Australian exchanges.
New: Manage All Your Stock Portfolios in One Place
We've created the ultimate portfolio companion for stock investors, and it's free.
• Connect an unlimited number of Portfolios and see your total in one currency• Be alerted to new Warning Signs or Risks via email or mobile• Track the Fair Value of your stocks
Try a Demo Portfolio for FreeHave feedback on this article? Concerned about the content? Get in touch with us directly. Alternatively, email editorial-team (at) simplywallst.com.This article by Simply Wall St is general in nature. We provide commentary based on historical data and analyst forecasts only using an unbiased methodology and our articles are not intended to be financial advice. It does not constitute a recommendation to buy or sell any stock, and does not take account of your objectives, or your financial situation. We aim to bring you long-term focused analysis driven by fundamental data. Note that our analysis may not factor in the latest price-sensitive company announcements or qualitative material. Simply Wall St has no position in any stocks mentioned.
Disclaimer: Investing carries risk. This is not financial advice. The above content should not be regarded as an offer, recommendation, or solicitation on acquiring or disposing of any financial products, any associated discussions, comments, or posts by author or other users should not be considered as such either. It is solely for general information purpose only, which does not consider your own investment objectives, financial situations or needs. TTM assumes no responsibility or warranty for the accuracy and completeness of the information, investors should do their own research and may seek professional advice before investing.
Most Discussed
- 1
- 2
- 3
- 4
- 5
- 6
- 7
- 8
- 9
- 10