Mantra price could hit $10 as CEX balances fall, open interest soars 6 seconds ago
Mantra’s price bounced back this week, with the ongoing drop in exchange balances signaling more potential gains.
Mantra (OM), a leading player in the Real World Asset or RWA) tokenization, rose to a high of $7 on Tuesday, up by almost 20% from its lowest level this month.
A key catalyst for the token is the continued decline in centralized exchange balances this week.
Data from Nansen shows that OM tokens held on exchanges have dropped over 7% in the past seven days to 345.94 million, down from more than 372 million a week ago. The total supply of OM on exchanges has fallen nearly 3% to 38.92%.

A decline in exchange reserves indicates that holders are not selling their tokens but are instead moving them to self-custody wallets.
Additional data shows that Mantra’s open interest in the futures market is increasing. According to CoinGlass, open interest has climbed to over $356 million, up from this month’s low of $319 million. Rising open interest is typically a sign that investors are optimistic about the token’s future.
Mantra price rose as the developers continued their investigations on malicious actors ahead of the GenDrop airdrop. GenDrop is a process where active members of the community will receive OM allocations. In a note, the developers removed 123,195 accounts, while 80,000 wallets are unallocated.
Mantra has become one of the best-performing cryptocurrencies since 2024, with its price surging from near zero to almost $10. This rally reflects growing confidence in MantraChain, which developers have positioned as the fastest and cheapest layer-1 network for RWA tokenization.
Mantra has also received a license to operate an exchange in Dubai. It also won a deal to tokenize assets worth over $1 billion for a large real estate company in the United Arab Emirates.
Mantra price analysis
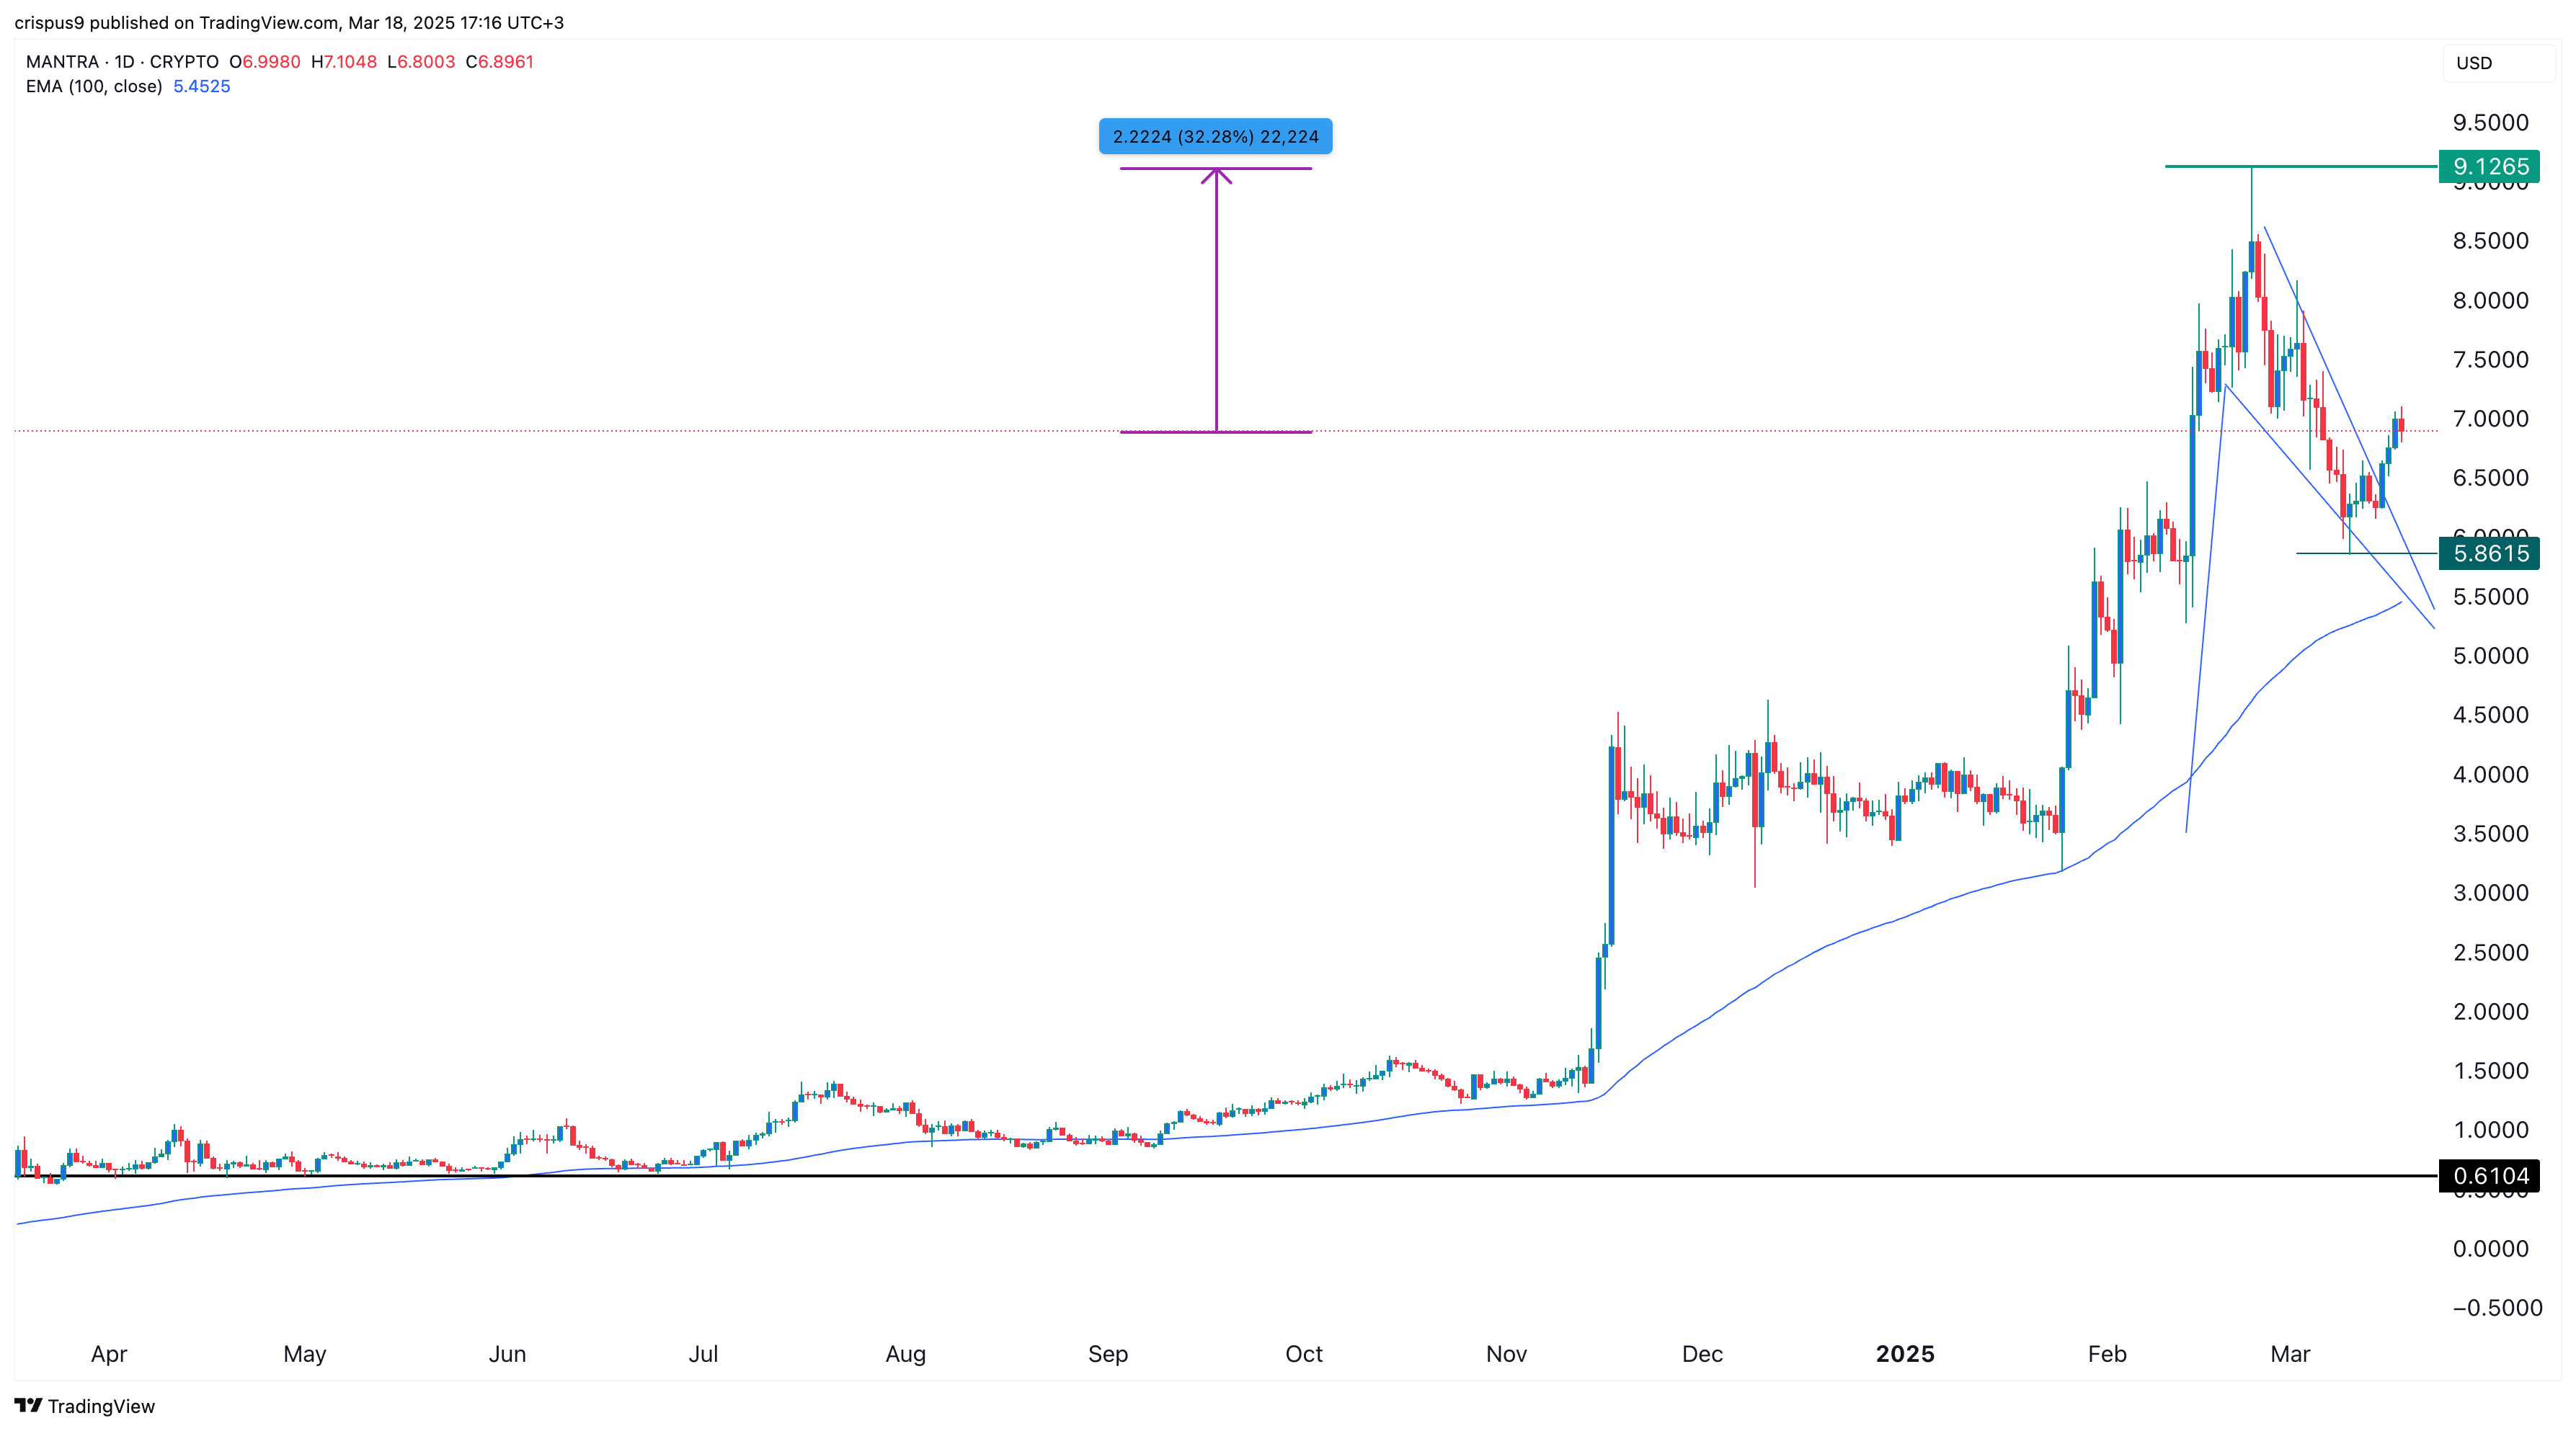
The daily chart shows that OM’s price bottomed at $5.86 on March 10 and has since rebounded to $6.90.
This rebound followed the formation of a falling wedge pattern, which consists of two descending and converging trendlines. Mantra also formed a bullish pennant chart pattern, characterized by a vertical line and a triangle formation.
OM also found support at the 100-day moving average. Therefore, there’s a strong chance that the token could rebound to its all-time high of $9.12, about 32% above the current level. A move above that level could pave the way for more gains, potentially reaching the psychological level of $10.
Disclaimer: Investing carries risk. This is not financial advice. The above content should not be regarded as an offer, recommendation, or solicitation on acquiring or disposing of any financial products, any associated discussions, comments, or posts by author or other users should not be considered as such either. It is solely for general information purpose only, which does not consider your own investment objectives, financial situations or needs. TTM assumes no responsibility or warranty for the accuracy and completeness of the information, investors should do their own research and may seek professional advice before investing.
Most Discussed
- 1
- 2
- 3
- 4
- 5
- 6
- 7
- 8
- 9
- 10