Revenues Working Against Caesars Entertainment, Inc.'s (NASDAQ:CZR) Share Price Following 29% Dive
Caesars Entertainment, Inc. (NASDAQ:CZR) shares have had a horrible month, losing 29% after a relatively good period beforehand. The drop over the last 30 days has capped off a tough year for shareholders, with the share price down 30% in that time.
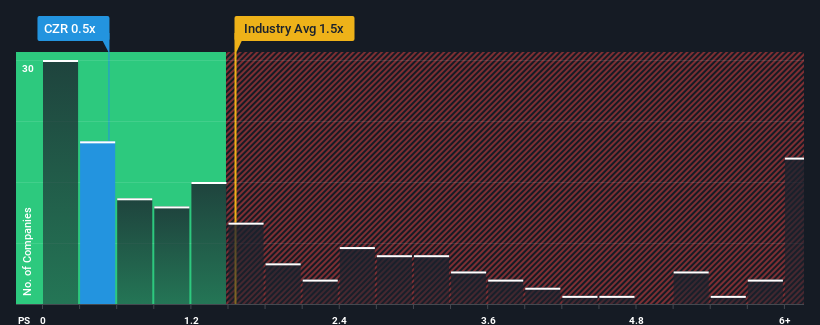
After such a large drop in price, Caesars Entertainment's price-to-sales (or "P/S") ratio of 0.5x might make it look like a buy right now compared to the Hospitality industry in the United States, where around half of the companies have P/S ratios above 1.6x and even P/S above 4x are quite common. Nonetheless, we'd need to dig a little deeper to determine if there is a rational basis for the reduced P/S.
See our latest analysis for Caesars Entertainment
What Does Caesars Entertainment's P/S Mean For Shareholders?
While the industry has experienced revenue growth lately, Caesars Entertainment's revenue has gone into reverse gear, which is not great. The P/S ratio is probably low because investors think this poor revenue performance isn't going to get any better. So while you could say the stock is cheap, investors will be looking for improvement before they see it as good value.
If you'd like to see what analysts are forecasting going forward, you should check out our free report on Caesars Entertainment.How Is Caesars Entertainment's Revenue Growth Trending?
In order to justify its P/S ratio, Caesars Entertainment would need to produce sluggish growth that's trailing the industry.
Taking a look back first, the company's revenue growth last year wasn't something to get excited about as it posted a disappointing decline of 2.5%. Regardless, revenue has managed to lift by a handy 18% in aggregate from three years ago, thanks to the earlier period of growth. Accordingly, while they would have preferred to keep the run going, shareholders would be roughly satisfied with the medium-term rates of revenue growth.
Looking ahead now, revenue is anticipated to climb by 3.0% per annum during the coming three years according to the analysts following the company. That's shaping up to be materially lower than the 13% each year growth forecast for the broader industry.
With this in consideration, its clear as to why Caesars Entertainment's P/S is falling short industry peers. Apparently many shareholders weren't comfortable holding on while the company is potentially eyeing a less prosperous future.
What Does Caesars Entertainment's P/S Mean For Investors?
Caesars Entertainment's recently weak share price has pulled its P/S back below other Hospitality companies. While the price-to-sales ratio shouldn't be the defining factor in whether you buy a stock or not, it's quite a capable barometer of revenue expectations.
As expected, our analysis of Caesars Entertainment's analyst forecasts confirms that the company's underwhelming revenue outlook is a major contributor to its low P/S. Shareholders' pessimism on the revenue prospects for the company seems to be the main contributor to the depressed P/S. The company will need a change of fortune to justify the P/S rising higher in the future.
The company's balance sheet is another key area for risk analysis. You can assess many of the main risks through our free balance sheet analysis for Caesars Entertainment with six simple checks.
If these risks are making you reconsider your opinion on Caesars Entertainment, explore our interactive list of high quality stocks to get an idea of what else is out there.
New: AI Stock Screener & Alerts
Our new AI Stock Screener scans the market every day to uncover opportunities.
• Dividend Powerhouses (3%+ Yield)• Undervalued Small Caps with Insider Buying• High growth Tech and AI CompaniesOr build your own from over 50 metrics.
Explore Now for FreeHave feedback on this article? Concerned about the content? Get in touch with us directly. Alternatively, email editorial-team (at) simplywallst.com.This article by Simply Wall St is general in nature. We provide commentary based on historical data and analyst forecasts only using an unbiased methodology and our articles are not intended to be financial advice. It does not constitute a recommendation to buy or sell any stock, and does not take account of your objectives, or your financial situation. We aim to bring you long-term focused analysis driven by fundamental data. Note that our analysis may not factor in the latest price-sensitive company announcements or qualitative material. Simply Wall St has no position in any stocks mentioned.
Disclaimer: Investing carries risk. This is not financial advice. The above content should not be regarded as an offer, recommendation, or solicitation on acquiring or disposing of any financial products, any associated discussions, comments, or posts by author or other users should not be considered as such either. It is solely for general information purpose only, which does not consider your own investment objectives, financial situations or needs. TTM assumes no responsibility or warranty for the accuracy and completeness of the information, investors should do their own research and may seek professional advice before investing.
Most Discussed
- 1
- 2
- 3
- 4
- 5
- 6
- 7
- 8
- 9
- 10